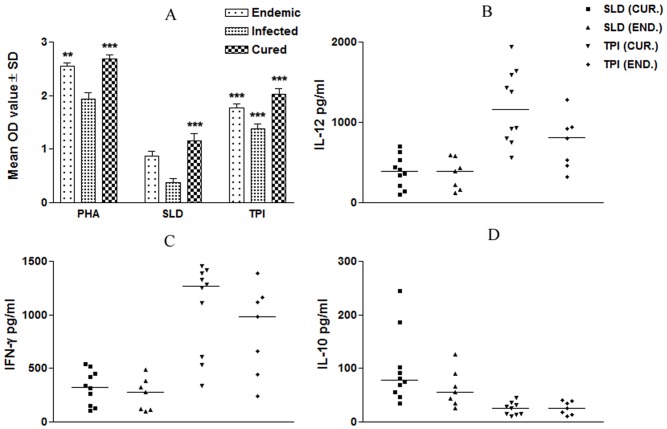
Figure 3. Cellular responses of LdTPI in human samples.
LTT response, proliferation was represented as mean O.D of stimulated culture - mean O.D of unstimulated control. Each bar represents the pooled data (mean ± S.D. value) of stimulated PBMCs of each group (A); Th1 and Th2 cytokine production in PBMCs from individuals of cured VL patients (n = 7) and endemic controls (n = 5) in response to rLdTPI and SLD antigens, each data point represents one individual (B-D). Values are given as concentration in pg/ml. The statistical significances are given between infected vs cured and infected vs endemic individuals. (*, p<0.05; **, p<0.01; and ***, p<0.001).

