
Figure 1. Water and food intake.
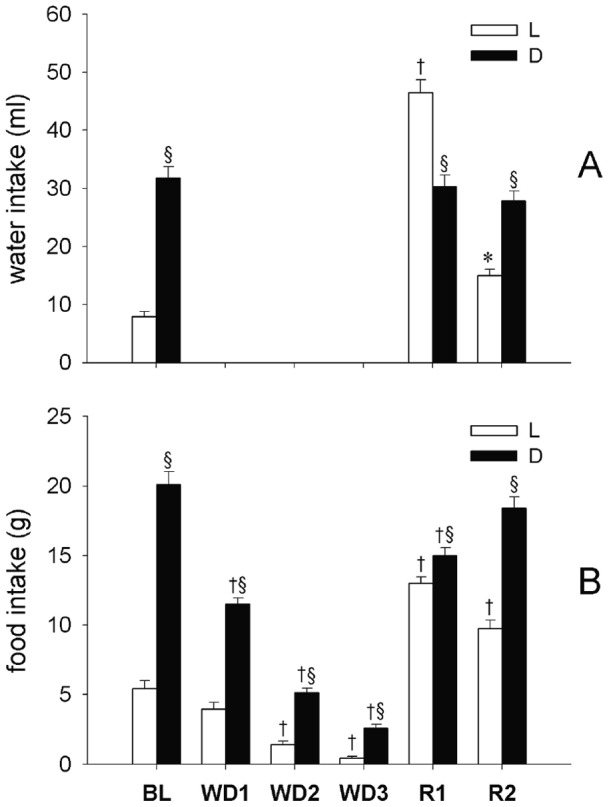
Water (ml) and food (g) intake in rats (n = 9) under normal laboratory conditions (one day of baseline, BL), during a three-day water deprivation protocol (WD1, WD2, WD3), and in the two days of recovery (R1, R2) which followed the reestablishment of access to water. Values (means ± S.E.M.) for the 12-h Light (L, white bars) and the 12-h Dark (D, black bars) periods are shown. Statistically significant comparisons are shown: treatment vs. BL (*, P<0.05; †, P<0.01); D vs. L (§, P<0.05).