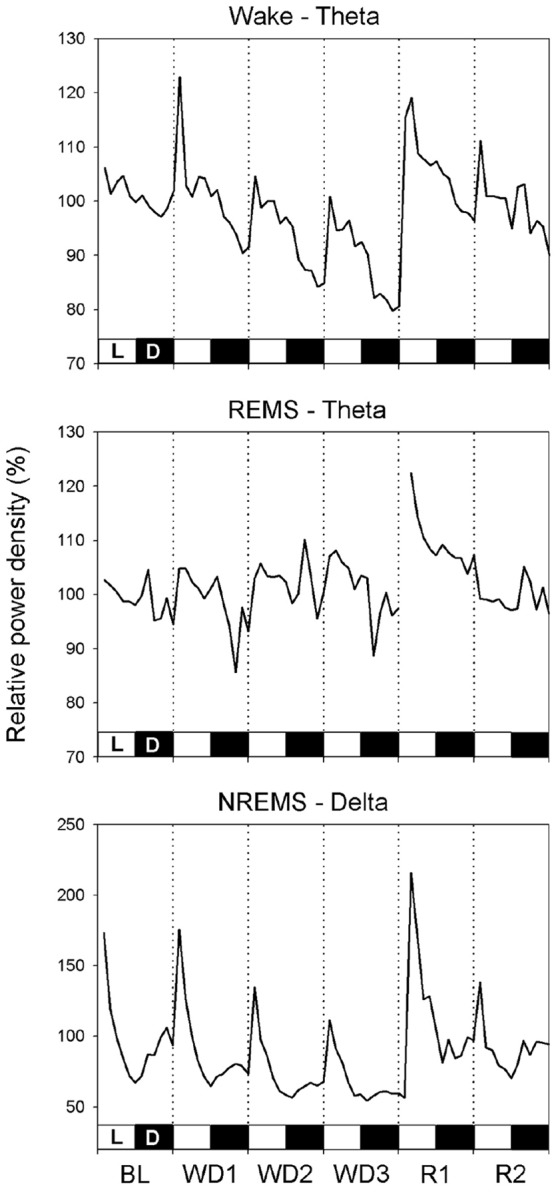
Figure 4. Power density in the different bands of the EEG during the different Wake–Sleep states.

Relative power density in the delta (0.75–4.0 Hz; DPW) band of the EEG during non-rapid eye movement sleep (NREMS) and in the theta (5.5–9.0 Hz, TPW) band of the EEG during either Wake or rapid eye movement sleep (REMS) in rats (n = 8) under normal laboratory conditions (average of two days of baseline, BL), during a three-day water deprivation protocol (WD1, WD2, WD3), and in the two days of recovery (R1, R2) which followed the reestablishment of access to water. Values (means ± S.E.M.) are shown with a 2-h resolution and expressed as the percentage of the mean 24-h level of the BL. The 12 h∶12 h Light (L, white bars) – Dark (D, black bars) rhythmicity is shown.
