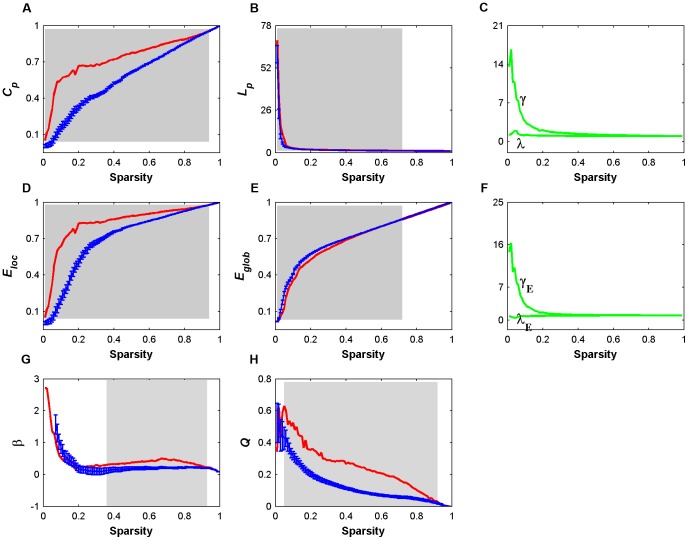
Figure 10. Small-world properties, network efficiency, Hierarchy ( ), and modularity (Q) of total-Hb-based functional networks as a function of sparsity threshold.
Error bars correspond to standard deviation of the mean for 1000 comparable random null networks (blue lines). The gray areas indicate the sparsity range over which the parameters derived from real brain network (red lines) are significantly (P<0.05) different from those derived from comparable random networks. Again, these results demonstrate efficient small-world properties, significant non-random hierarchical and modular organization of total-Hb-based functional brain networks.

