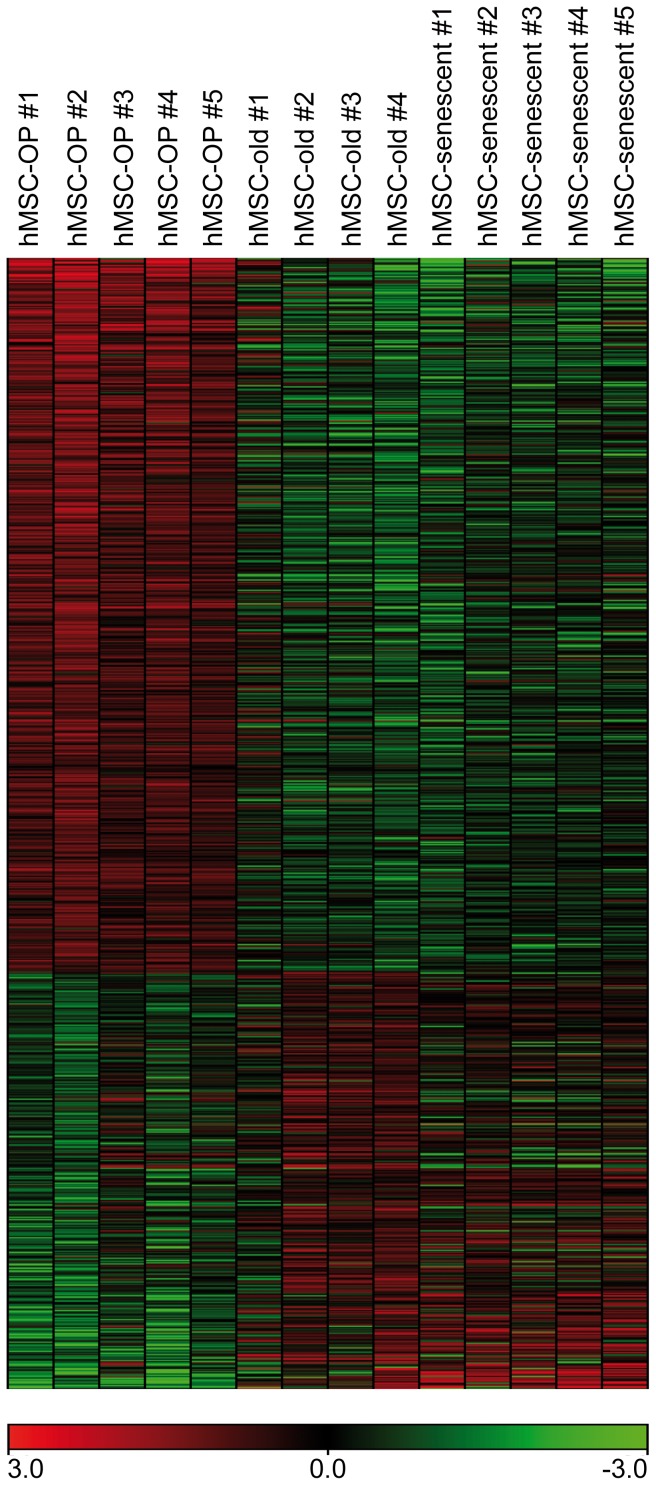
Figure 2. Heat map of microarray results of osteoporotic and aged hMSC.
Color-coded microarray hybridization signals (green to red = low to high signals) of hMSC-OP, hMSC-old and hMSC-senescent. The 998 gene products depicted showed at least 2fold differential gene expression (630 enhanced, 368 reduced; FDR<10%) in SAM comparison of hMSC-OP versus hMSC-C (for gene names see Table S2).

