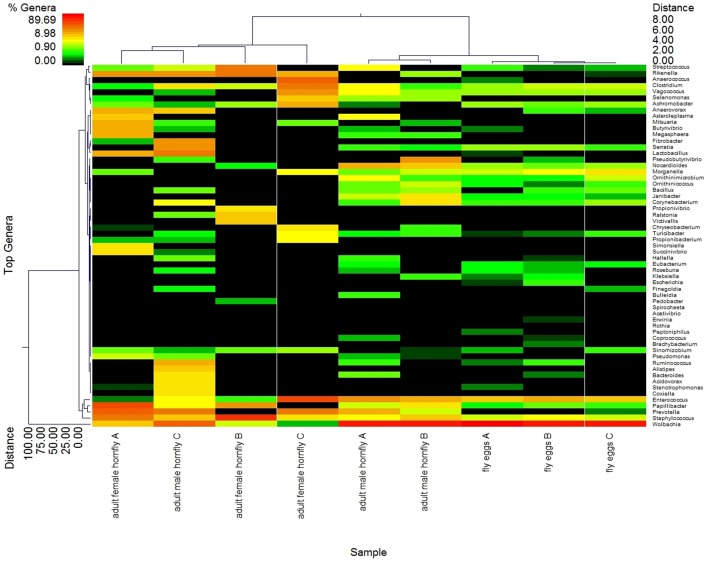
Figure 1. Heat map depicting bacterial diversity and relative abundance in life stages from the horn fly.
Letters (A–C) used to identify individual life stage replicates. Double hierarchical dendogram shows different bacteria distribution between genera based on complete linkage clustering, and Manhattan distance methods with no scaling. Dendrogram linkages and distance of the bacterial genus or trace back groups are not phylogenetic, but based upon relative abundance of the genus within the samples. Traceback means bacterial classifications were based upon the percent identity of the sample sequence to known sequences, the percent divergence was then used to adjust identifications to the taxonomic level with the highest degree of confidence (e.g. a percent divergence <3% can be expected to provide confidence at the species level, >3% but <5% at the genera level, etc). Classifications were compiled after traceback. Legend and scale shown in upper left corner of the figure represent colors in heat map associated with the relative percentage of each traceback grouping of bacteria (cluster of variables in Y-axis) within each fly sample (X-axis clustering). Fly samples along the X-axis with Manhattan distances are indicated by branch length and associated with the scale located at the upper right corner of the figure. Bacterial genera along the Y-axis are also clustered according to Manhattan distances; the respective scale is indicated in the figure's lower left corner.

