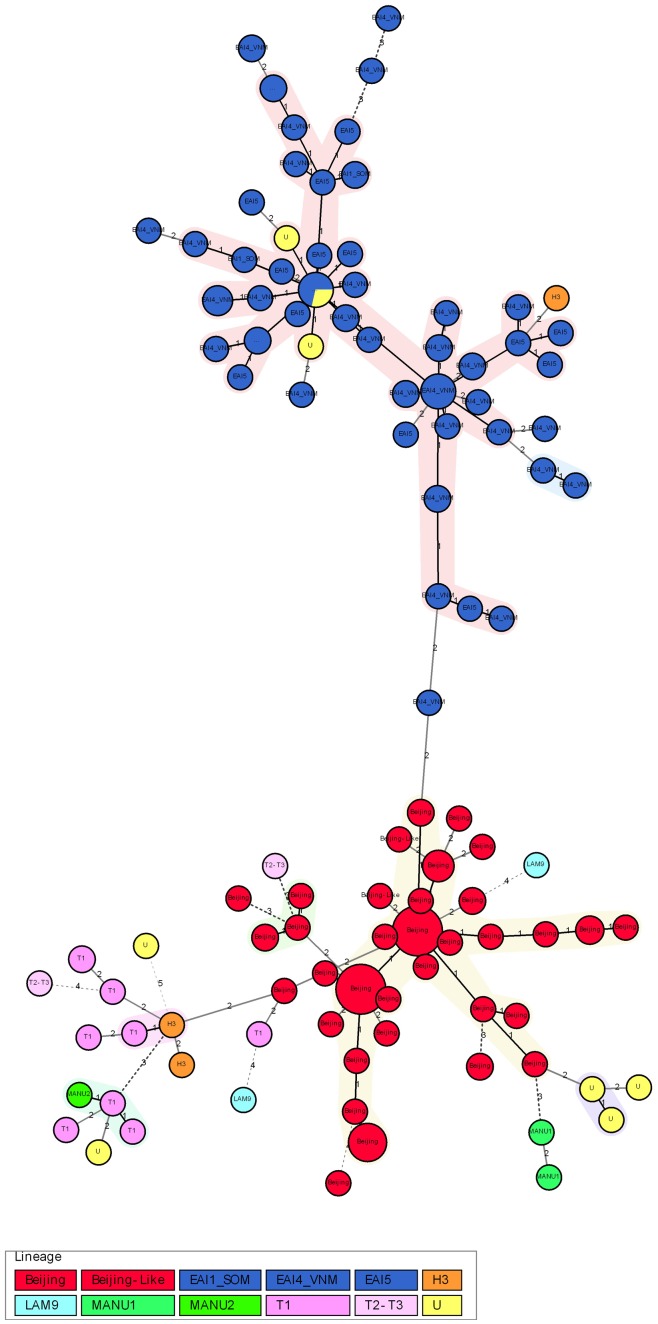
Figure 3. Minimum spanning tree of the studied M. tuberculosis isolates in the northern Vietnam based on 12-MIRU types.
Blue = EAI lineage, red = Beijing lineage. The sizes of the circles correspond to the frequencies of the MIRU types. The numbers on the connection lines indicate the numbers of locus differences.

