
Figure 1. Correlation between the dose percent of 6-MP and MTX in each patient and TPMP genotype.
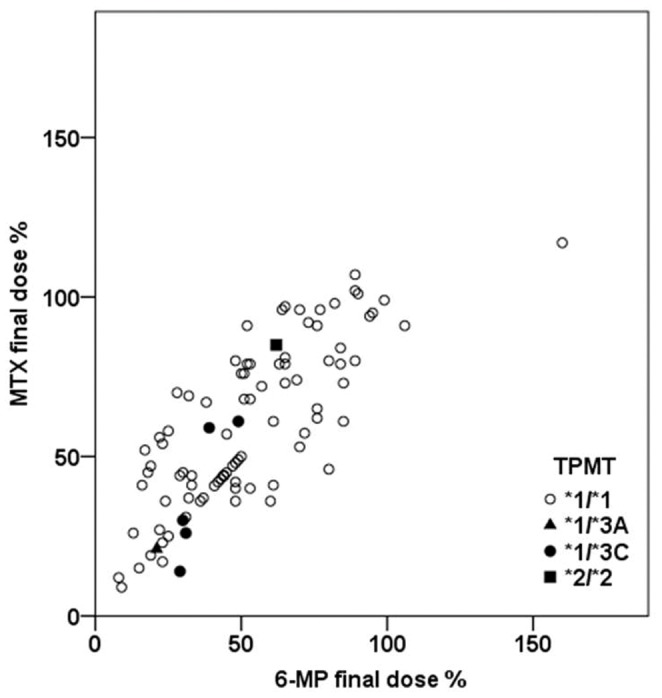
The correlation analysis between the dose percent of 6-MP and MTX in each patient showed a statistically significant linear relationship (R 2 = 0.628, P = 0.00).