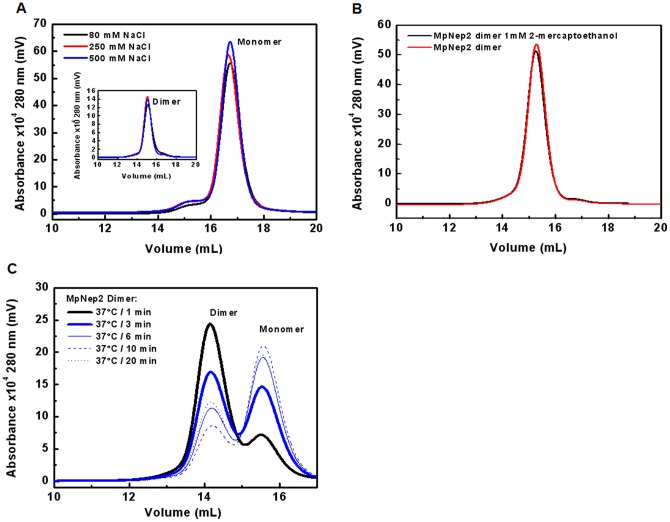
Figure 2. Analysis of MpNep2-MpNep2 interaction.
A. UFLC performed at different ionic strengths for MpNep2 monomer (main painel) and dimer (inset). B. UFLC of MpNep2 dimer immediately performed after treatment with 1 mM 2-mercaptoethanol (black line). Non-treated protein is depicted as red line. C. UFLC of MpNep2 dimer after exposure to 37°C from 1–20 min. Traces were recorded at 280 nm and 0.7 mL.min−1 using Superdex 200.

