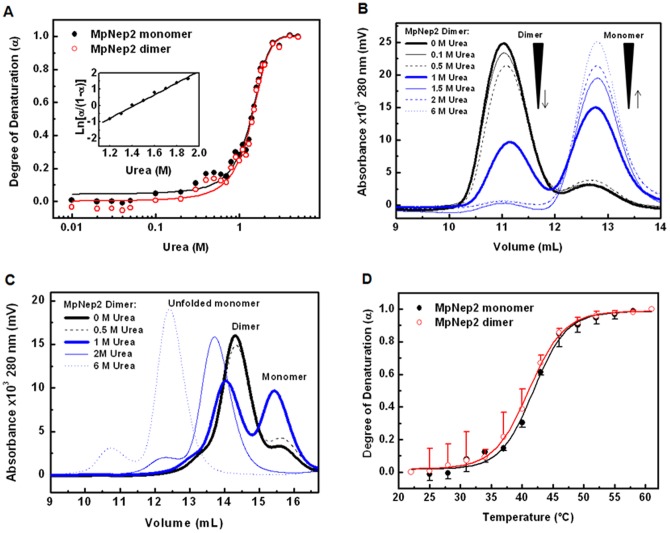
Figure 5. Thermodynamic characterization of monomeric and dimeric MpNep2 by chemical and physical agents.
A. Urea denaturation plots obtained by monitoring Trp fluorescence emission and calculating as degree of denaturation (α) from equations 1 and 2 (see Material and methods). Inset shows linear regression of  versus urea. B. MpNep2 dimer treated with different urea concentrations and recorded by UFLC with a running buffer that do not contain urea. C. MpNep2 dimer treated with different urea concentrations and recorded by UFLC with a running buffer containing the corresponding urea concentration depicted on legend. D. Thermal denaturation plots obtained by monitoring Trp fluorescence emission and calculating degree of denaturation. A and D – Experiments are shown as mean (n = 3) with independent protein preparations. B and C – UFLC was performed on Superdex 75 and Superdex 200, respectively at 0.7 mL.min−1.

