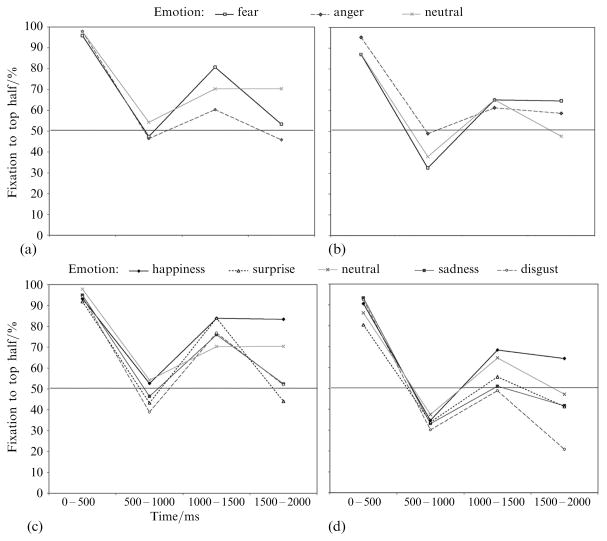
Figure 3.
Percentage of fixations directed to the top half of the face in the hearing group [(a) and (c)] and deaf group [(b) and (d)] for each emotional expression. (a) and (c) Gaze data for the emotions that subjects better recognized from the top half of the face than the bottom (fear and anger). (b) and (d) Gaze data for emotions better recognized by the bottom half of the face (happiness, sadness, surprise, and disgust). Fixation patterns were qualitatively similar for both categories of emotional expressions. Gaze data in response to neutral expressions are shown on both graphs for comparison.

