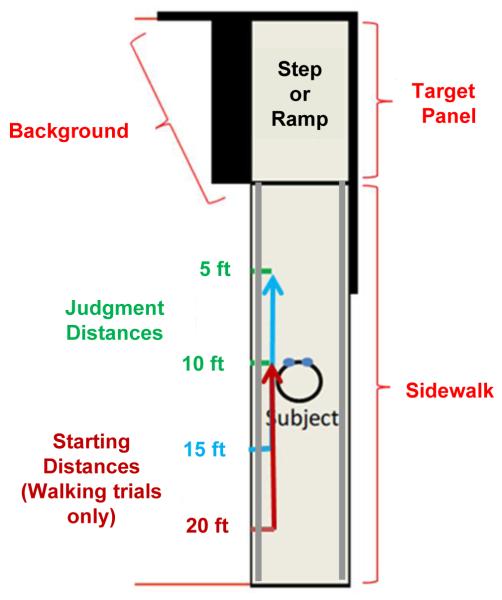
Figure 1.
Schematic diagram of the test space, showing the target panel (upper left), the sidewalk, the black background, the two stationary viewing locations in green (5 ft and 10 ft), and the two starting locations for the walking trials in blue (15 ft and 20 ft). The gray, metal railings were present for the walking trials only. With the omission of the hand rails, the identical test space was used in Legge et al., 2010.3 A color version of this figure is available online at www.optvissci.com.

