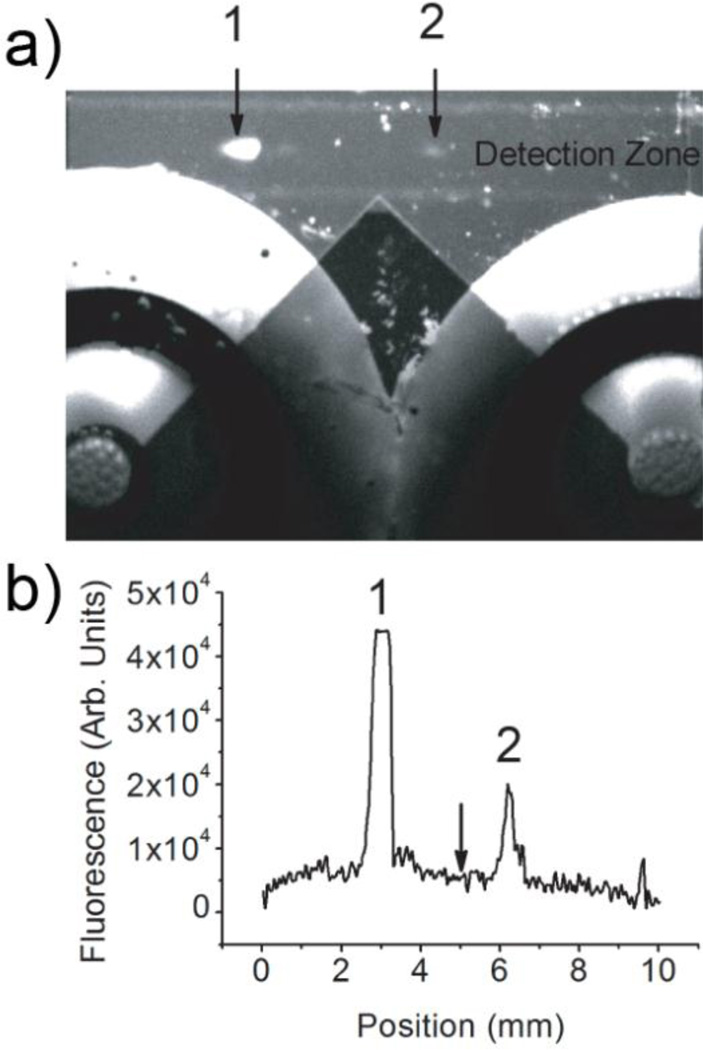
Figure 2.
(a) An image of a μFFE separation of free (1) and bound ssDNA (2) recorded during selection cycle #1. The fraction collection channels and outlet ports are clearly visible in this image. (b) A linescan across the detection zone imaged in (a). The arrow indicates the fraction cutoff point at the exit of the μFFE channel demonstrating clear separation of free (1) from bound (2) ssDNA. The anode is on the left in all images.

