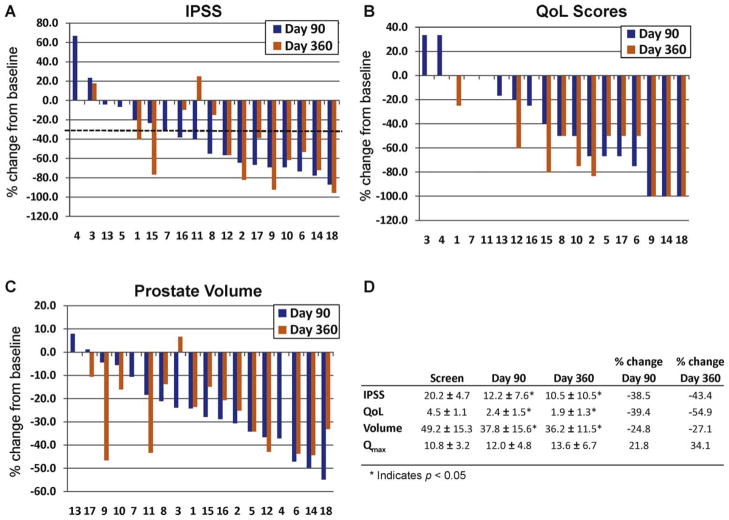
Fig. 3.
Combined results from all cohorts treated with increasing concentrations of PRX302 in the phase 2 study. The y-axis is the percent change in parameters compared to the day 0 value; the x-axis denotes individual patient numbers. The percent change in (A) International Prostate Symptom Score (IPSS), (B) quality of life (QoL) score; (C) and prostate volume for each patient at day 90 and day 360 compared to the day 0 value. The dotted line indicates 30% improvement. (D) The average values plus or minus standard error for IPSS, QoL, prostate volume, and maximum flow rate across all cohorts at 0, 90, and 360 days.
IPSS = International Prostate Symptom Score; QoL = quality of life; Qmax = maximum flow rate.

