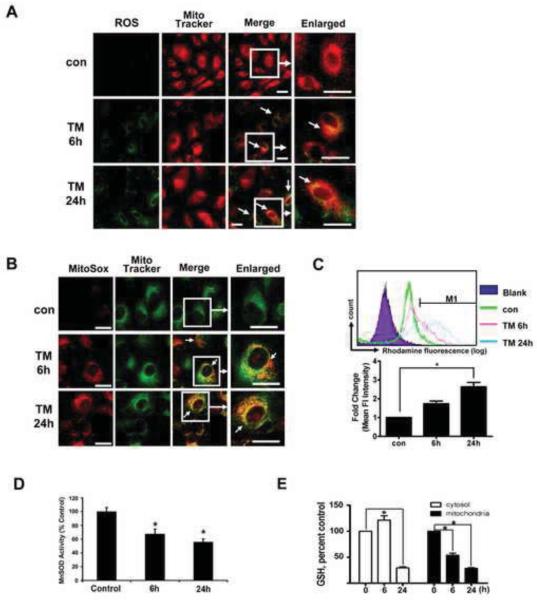
Fig.3. TM treatment of hRPE cells results in increased ROS in mitochondria, decreased MnSOD activity and depletion of mitochondrial GSH.
A. hRPE cells were treated with 3 μg/ml TM for 6 h and 24 h. Carboxy-H2DCFDA and Mito Tracker were added to the cultures 60 min and 30 min before the end of the treatment respectively to achieve double labeling for ROS (green) and mitochondria (red). As seen in merged confocal images in A (white arrows), TM treatment caused marked production of ROS. The increased ROS mainly accumulated in mitochondria of RPE cells as shown by MitoSOX (red) and MitoTracker (green) as shown in B. C. Representative tracings from flow cytometric analysis demonstrating time dependent increase in mean fluorescent intensity of oxidized MitoSOX following 3μg/ml TM treatment (upper panel). The bar graphs (lower panel) show quantitation of time dependent changes in mean fluorescent intensity of oxidized MitoSOX following TM exposure. D. Effect of ER stress on MnSOD activity in RPE. SOD activity decreased significantly with 3μg/ml TM treatment at 6 h and 24 h. Data are expressed as % of control SOD values. E. Time dependent changes in reduced glutathione (GSH) levels in cytosolic and mitochondrial pools after exposure to 3 μg/ml TM showing progressive depletion of mitochondrial GSH with exposure time to TM. Data presented in the bar graphs are mean ± S.D. (n=3). * p<0.05. Bar: 10 μm.

