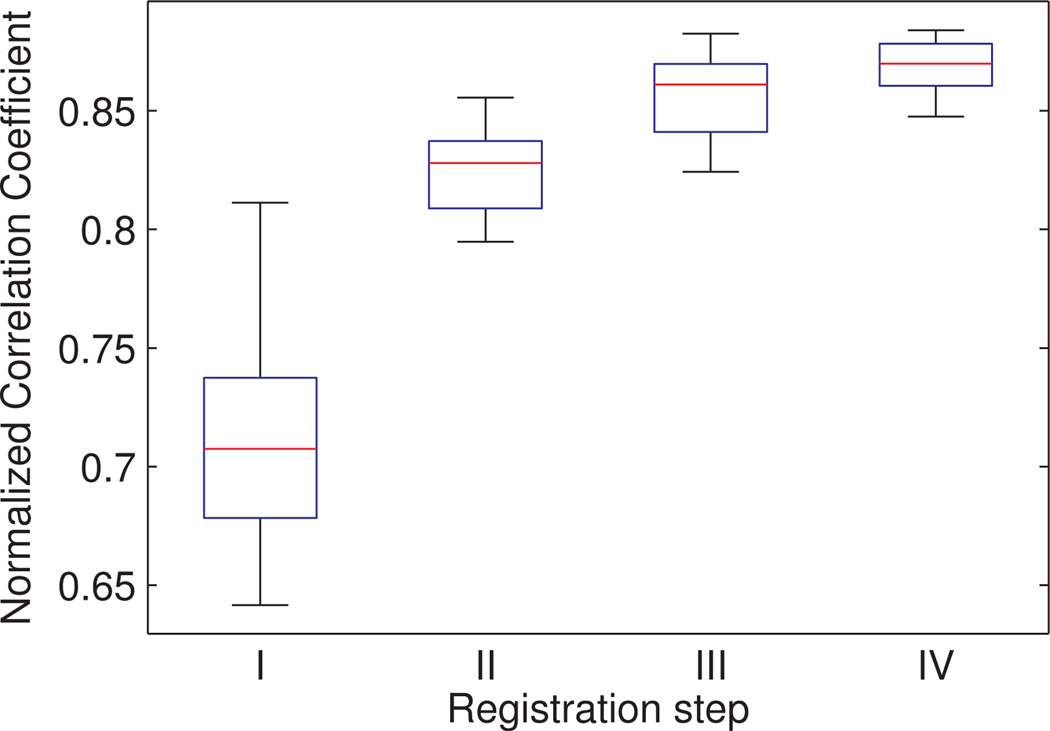
Figure 5.
Similarity between pairs of DTI datasets (represented by the FA map), which were (I) not aligned (original data), (II) affinely aligned, (III) nonrigidly aligned to a single subject, and (IV) nonrigidly aligned to the population-averaged DTI brain template, was evaluated with the normalized correlation coefficient. Each set of FA maps resulted in 36 pairwise calculated normalized correlation coefficients, of which the median value is indicated by the red lines. The lower and upper edges of the boxes correspond to the 25th and 75th percentiles, respectively.

