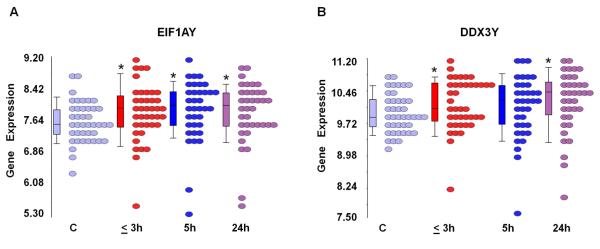
Figure 1.
Expression of genes in the NRY region of the Y chromosome differentially expressed following ischemic stroke. RNA expression (log2-transformed intensity values) is shown on the Y axis for EIF1AY (A) and DDX3Y (B). Control male subjects and male patients at different time points following ischemic stroke (≤ 3h, 5h, 24h) are shown on the X axis, each circle represents a single patient. Note: * = significantly changed following stroke compared to control (C) (p<0.05, FC>∣1.2∣).

