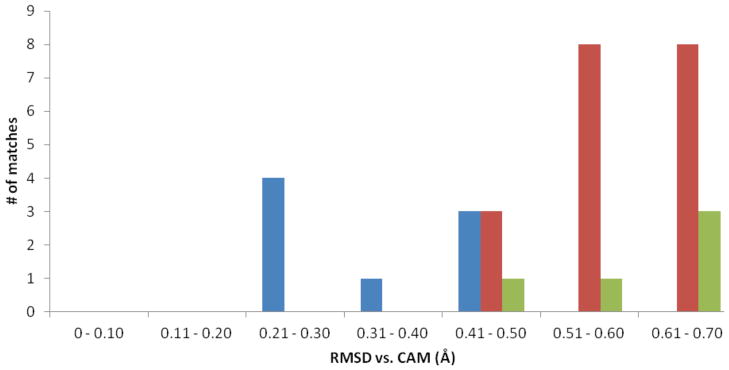
Figure 4.
Results of the analysis of using the 1ZC0 Catalytic Atom Map to search the PDB90(2Å) data set. The blue bars indicate the number of correctly identified TyrP-like catalytic triads, while the red bars indicate groups of atoms that matched the CAM geometry but were not part of a TyrP catalytic triad. The green bars are incorrectly identified triads that remained after the WCN filter was applied.

