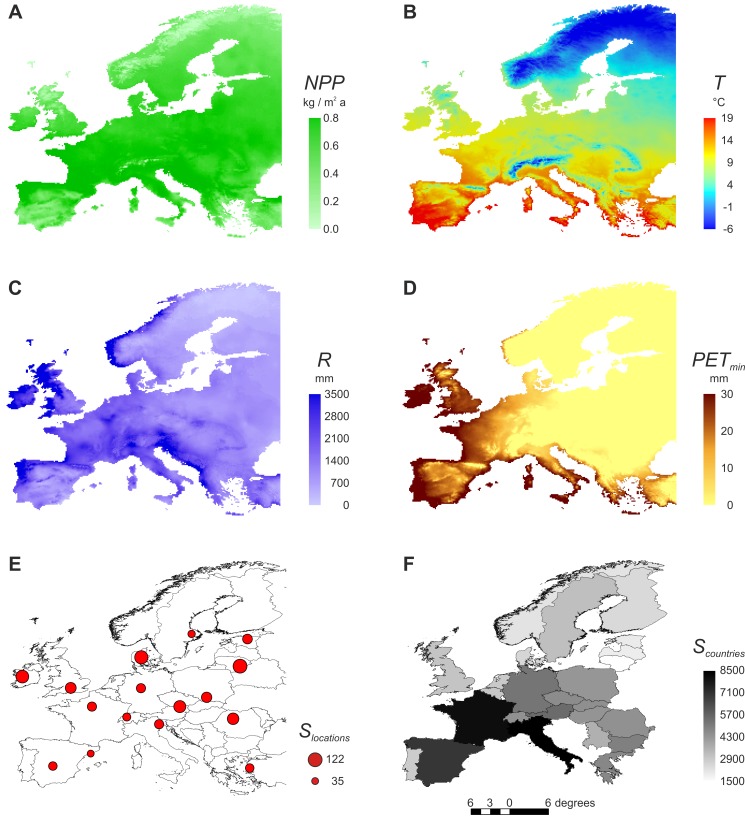
Figure 1. Map of Europe showing the studied environmental variables.
(A) NPP = net primary productivity, (B) T = annual mean temperature, (C) R = annual rainfall, and (D) PETmin = potential evapotranspiration of the coldest month, plus (E) the N = 16 study locations with their species richness Slocations (all groups combined; average between natural and disturbed habitat) and (F) the N = 25 analysed countries with their species richness Scountries (all groups combined).

