
Figure 10.
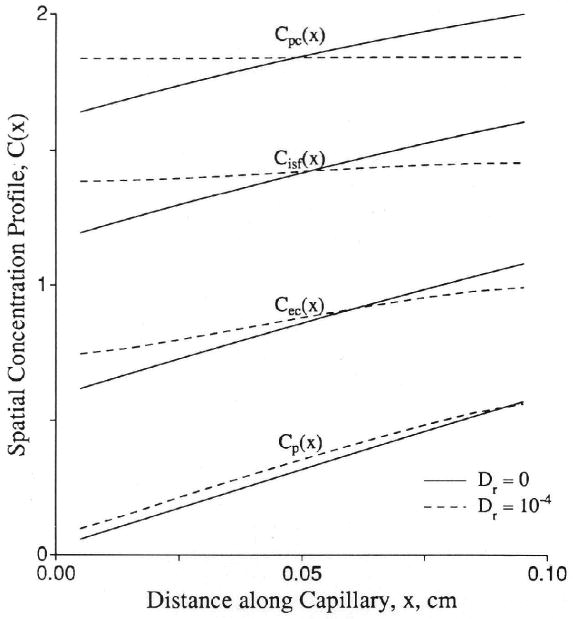
Graph showing spatial concentration (C) profiles in a capillary-tissue exchange unit at t = 200 seconds. At this time, the concentration in each location relative to the peak concentration in the downstream corner remains at a constant ratio. The parameters were Fp = PSecl = PSeca = PSpc = 1.0 (ml/g)/min; PSg = 0; Vp = 0.05, , , and . (For definition of terms, refer to Figure 1.) Control axial diffusion (Dr) = 0 (solid lines); all Dr = 10−4 cm2/sec (dashed lines). At t = 200 seconds, the residue function is 0.044 for the control case and 0.045 for the test case. The fractional escape rates η(t) at t = 200 sec were 0.00771/sec for Dr = 0 and 0.00755/sec for Dr = 10−4 cm2/sec.