
Figure 11.
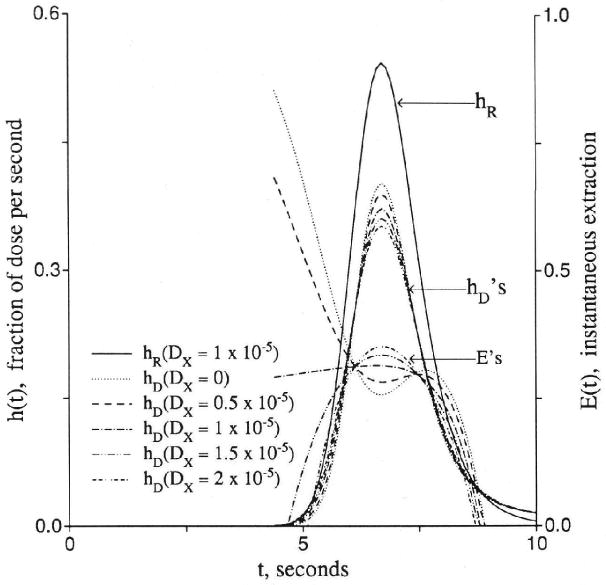
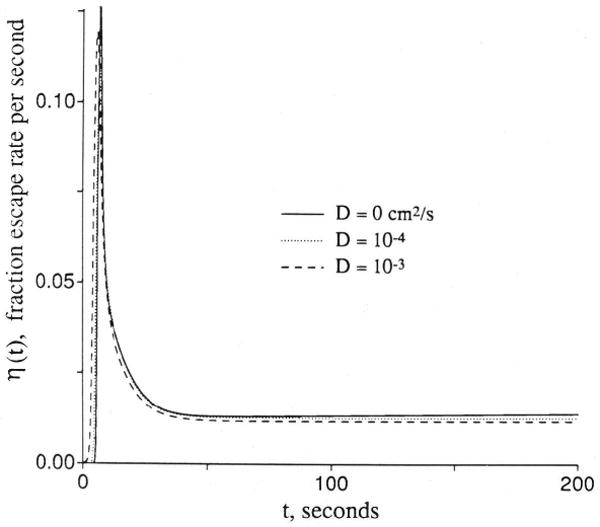
Graphs showing effects of axial diffusion (D or Dx) on the shape of outflow dilution curve [h(t)], instantaneous extraction [E(t)], and fractional escape rate [η(t)]. Upper panel: Curves for intravascular reference tracer (hR), test diffusible solute (hD), and E(t) at different ratios of intraplasma diffusion coefficients. Lower panel: Fractional escape rates η(t) = h(t)/R(t) for the permeating tracer at different diffusion coefficients. All permeability–surface area products are 1.0 (ml/g)/min.