
Figure 13.
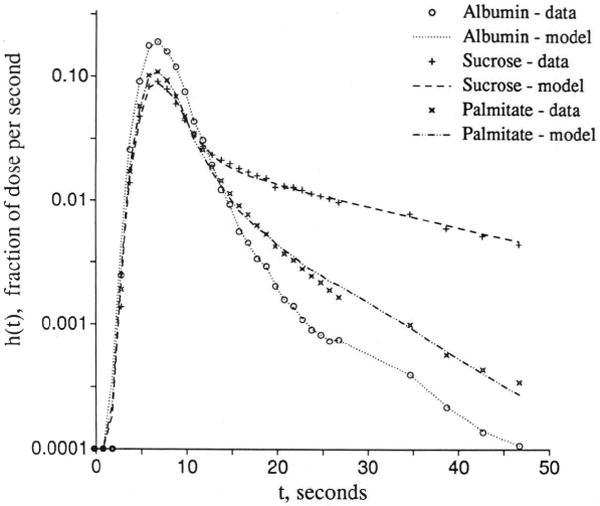
Graph showing palmitate uptake in the isolated rabbit heart. Outflow dilution curves [h(t)s] for albumin, sucrose, and [14C]palmitate were obtained with Krebs-Ringer perfusate containing 0.4 mM albumin and 0.4 mM total palmitate at Fp = 1.6 (ml/g)/min. Model-to-data coefficients of variation were 9.5% for albumin curve, 6.4% for sucrose, and 7.3% for adenosine. Flow heterogeneity was accounted for by five paths with a relative dispersion of 50%. for sucrose. The cleft PSg was 1.31 (ml/g)/min for sucrose and 0 for palmitate. Other palmitate parameters were PSecl = 1.02, PSeca = 1.4, Gec = 0, PSpc = 2.7, and Gpc = 8.1 (ml/g)/min and , Vp = 0.04, and (G. van der Vusse and S. Little, unpublished data). (For definition of terms, refer to Figure 1.)