
Figure 4.
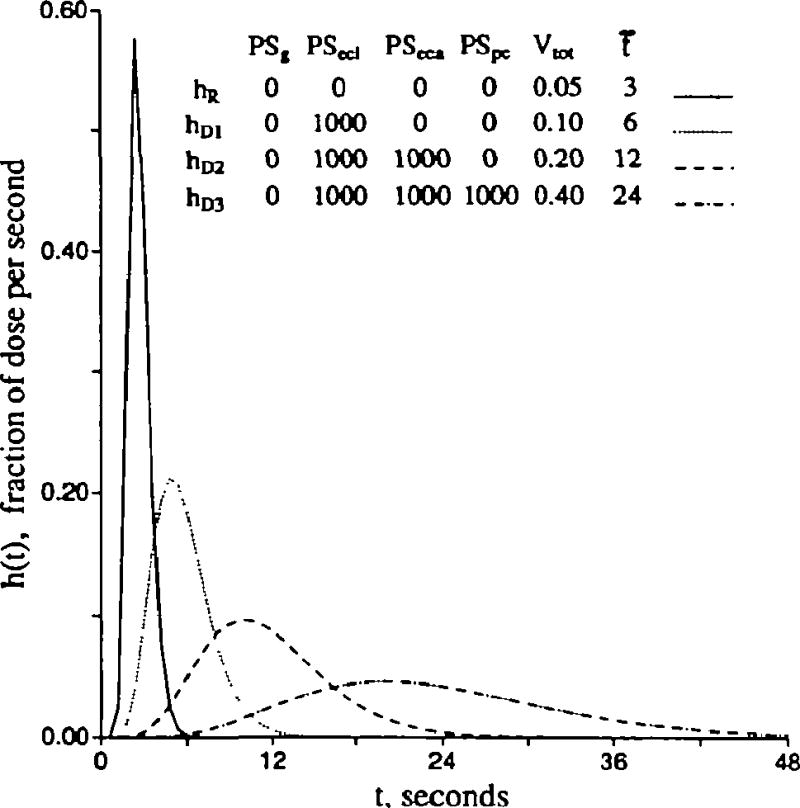
Graph showing flow-limited exchange between plasma and surrounding regions. The response hR(t) is a vascular reference curve identical to that of Figure 3. The outflow curves [h(t)s] for the permeant represent three cases with free entry and exchange with endothelial cells only (hD1), with endothelial cells plus interstitial fluid (hD2), and with all three extravascular regions (hD3). hR is the intravascular reference tracer. The mean transit time, t̄, for each case is the total volume of distribution divided by the flow Fs = 1.0 (ml/g)/min. The volumes were Vp = 0.05, , , and . (For definition of terms, refer to Figure 1.) Vtot is the total volume accessible to solute, ml/g.