
Figure 6.
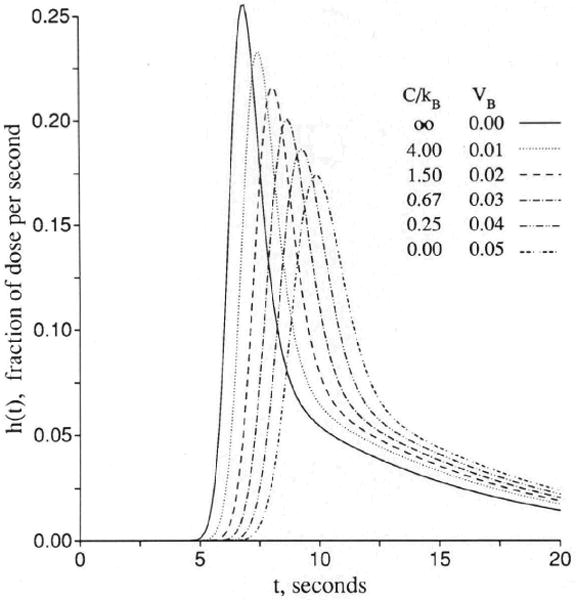
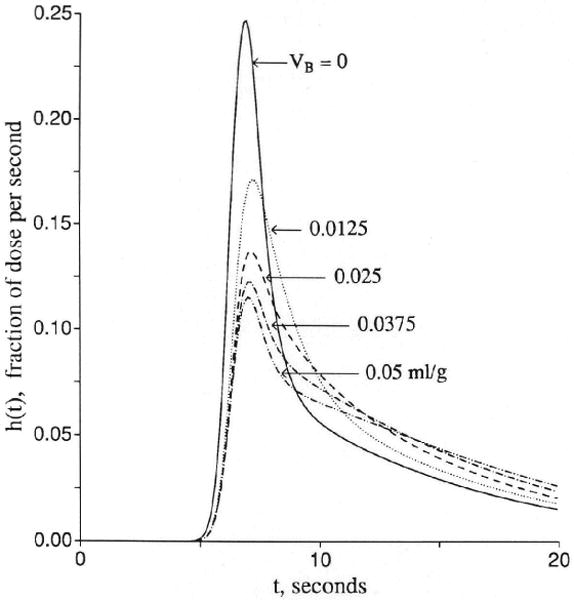
Graphs showing receptor binding: effects of rapid equilibrative surface binding versus slow exchange with a surface receptor site in parallel with entry into endothelial cells. Left panel: An equilibrating surface binding site acts simply as an enlarged volume of distribution. Because binding and unbinding are “infinitely” rapid there is no limitation to exchange with the additional space, and the outflow curve shows a flow-limited form similar to that for which there is no binding. h(t) is the normalized outflow dilution curve. Parameters to represent surface binding are PSB = 1,000 (ml/g)/min, Vp = 0.05 ml/g, and VB = 0−0.05 ml/g; others are the same as in right panel. Right panel: Slow exchange with a receptor on the endothelial luminal surface is analogous, for tracer, with first-order exchange with another region. In these curves the tracer exchanges with both the endothelial cell and with a binding site. Both are first-order exchanges, applicable to a situation with constant concentrations of nontracer mother solute; even the transport or binding processes may be concentration dependent. The conditions for this figure are Fp = 1.0, PSecl = 1.0, PSeca = 0, PSg = 0, Gec = 0, and PSB = 1.0 (ml/g)/min, while and VB varied from 0 to 0.05 ml/g. (For definition of terms, refer to Figure 1; input function is the same as in Figure 3; kB and VB are defined with Equation 52.)