
Figure 9.
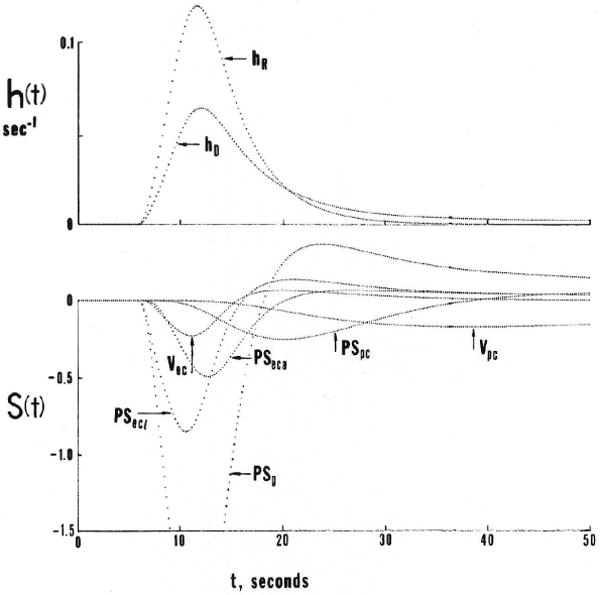

Graphs showing sensitivity functions for the four-region capillary-endothelial-interstitial cell model. Upper curves show the model responses to a dispersed input function [h(t)] for both a vascular reference solute (hR) and a permeating solute hD. Lower panels show sensitivity function [S(t)] for several parameters. Left panel: PSg and PSecl are relatively low. Right panel: With higher PSg, the sensitivities to more distant events, governed by PSpc and Vpc, are increased. (For definition of terms, refer to Figure 1.)