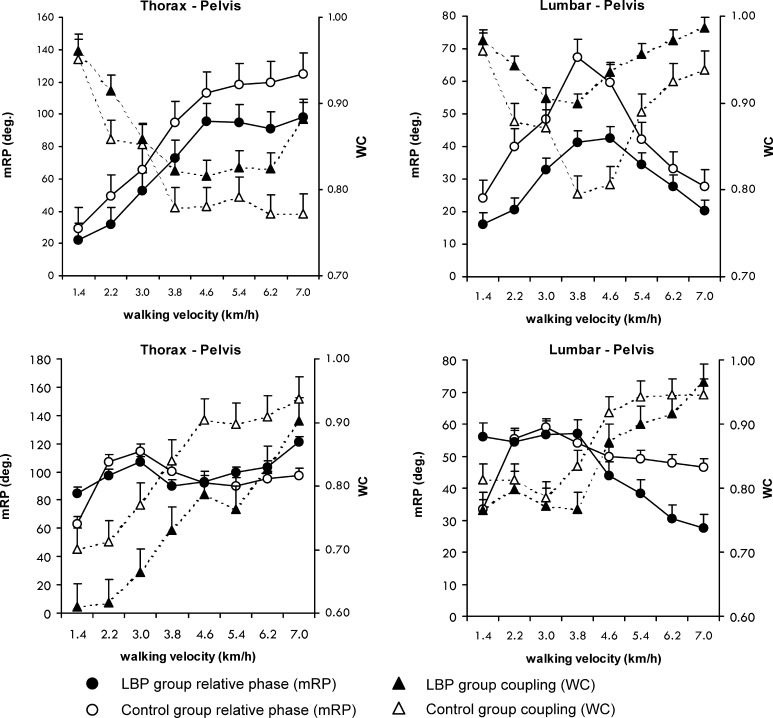
Fig. 3.
Mean relative Fourier phase (mRP) and the coupling (WC) between thoracic–pelvic and lumbar–pelvic rotations in the transverse plane (upper panels) and frontal plane (lower panels). The left y-axis represents values of the mRP, and the right y-axis values of the coupling (WC) between the segments

