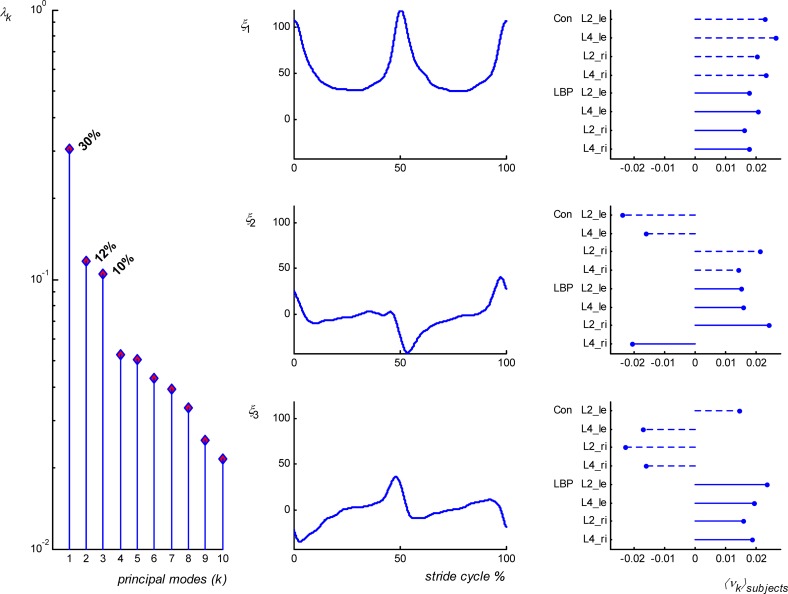
Fig. 6.
PCA of EMG data obtained at a walking velocity of 5.4 km/h. The first column shows the eigenvalue spectra (λk); note the decrease in eigenvalues after mode 3. The second column shows the time series (ξ1..ξ3) corresponding to the first three modes, which together formed the global pattern of LES activity. The eigenvector coefficients (νk) are averaged over strides of LBP and control (Con) participants and represent the contribution of each muscle per group to the pattern (column 3)

