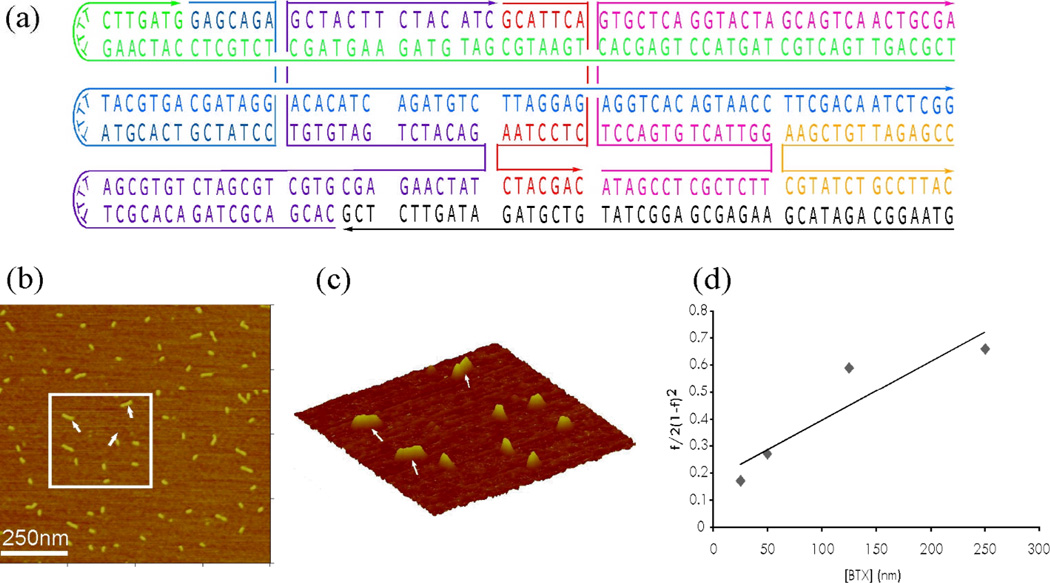
Fig. 4.
Calculation of the Binding Constant. (a) Schematic drawings of the DNA BTX Molecule Used to Measure the Association Constant. The BTX molecule was capped with short T4 loops on one end. The sequence is based on Tile B. (b) An AFM Image of BTX Molecule at a Concentration of 125 nM. The scan size is 1 µm × 1 µm a sufficiently high resolution to distinguish between dimers and monomers. (c) A 3D View of the Rectangle Area within the Image. Arrows point to dimers, which are clearly distinct from monomers. (d) Representative Plot used for Kd Determination. Kd is the inverse slope of the line and is 4.5 × 10⁻⁷ M for the conditions used (25 °C, 10.5 mM Mg2+).

