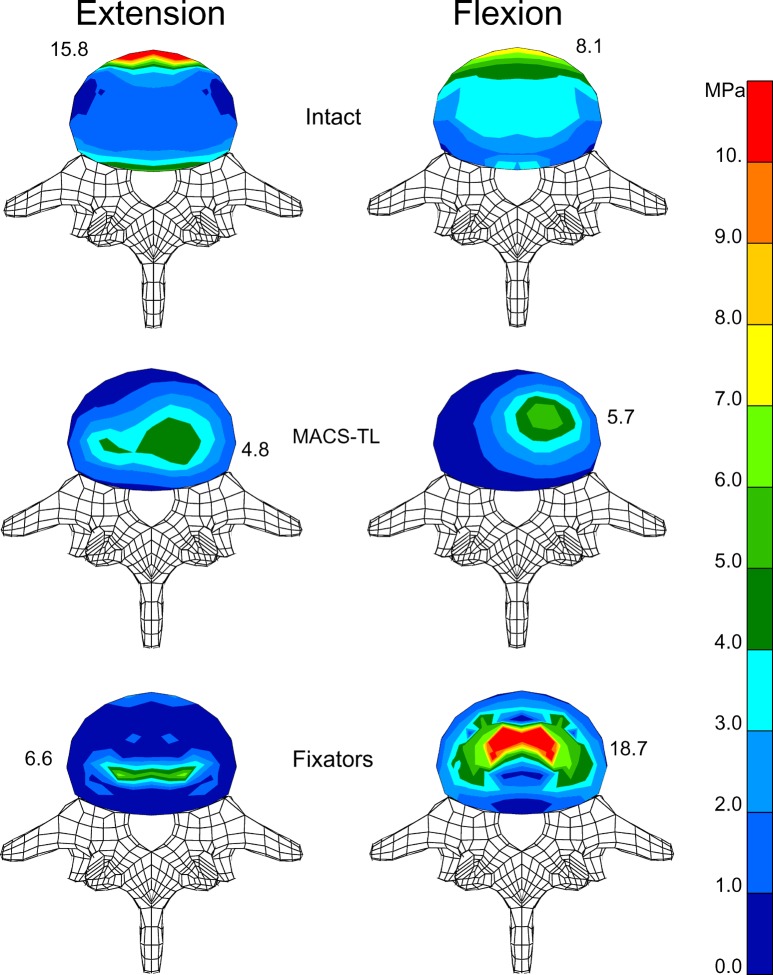
Fig. 6.
Distribution of von Mises stresses in the lower endplate of L3 for extension ( left) and flexion ( right). Stress distribution is shown for the intact model ( top), after implantation of a MACS-TL system ( middle), and after insertion of an internal fixation device ( bottom). Maximum stress value for each endplate is also given

