Figure 11 .
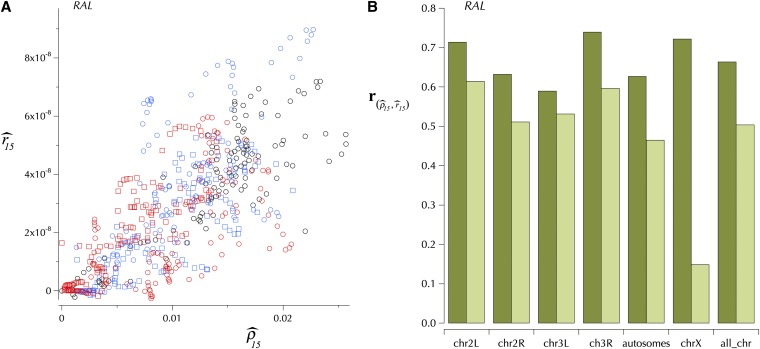
Common patterns of the genomic distribution of the two estimates of the rate of recombination per base pair, and . (A) A scatterplot of these two estimates in windows of variable sizes (all >104 bp) for each of the untrimmed chromosome arms. Eight outliers are off this plot (2R, −0.0027, −6.2 × 10⁻⁹; X, 0.0321, 1.9 × 10⁻⁸; 0.0375, 2.2 × 10⁻⁸; 0.0400, 2.5 × 10⁻⁸; 0.0404, 2.7 × 10⁻⁸; 0.0373, 3.0 × 10⁻⁸; 0.0314, 3.3 × 10⁻⁸; 0.0275, 3.7 × 10⁻⁸). B compares the base pair-weighted correlation logarithms of and , among chromosome arms for both trimmed (light green) and untrimmed (dark green). The parallels between the two measures are high, but reduced slightly when only the trimmed regions are considered. This is not true for chromosome X, which shows much less correlation between the two estimates on the trimmed data.

