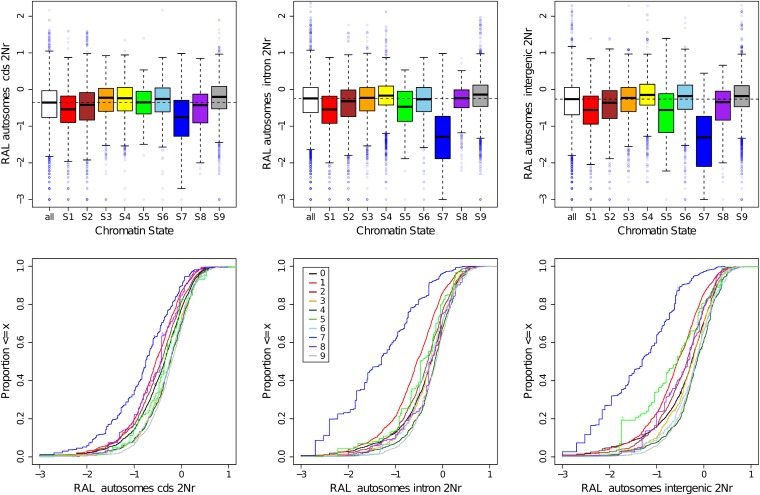
Figure 14 .
The distribution of -values in windows partitioned by chromatin state inferred in S2 cells and gene structure (coding, intron, and intergenic). The top row shows box plots (boxes are the central two quartiles, the whiskers are 1.5 times those, and the dots with light shading represent the outliers beyond the whiskers). The empirical cumulative distribution functions (ecdfs) in the bottom row give a perhaps clearer alternative view of the differences in the distributions of between chromatin states in the coding, intronic, and intergenic regions. Also see Figure S11 and Figure S12 for the box plots and ecdfs (respectively) for πw (RAL, MW, and SIM), δw (RAL, MW, and SIM), HKAl (RAL, MW, and SIM), HBKl, and . “all” in the box plots and “0” in the ecdfs refer to the sum of the chromatin states, 1–9.

