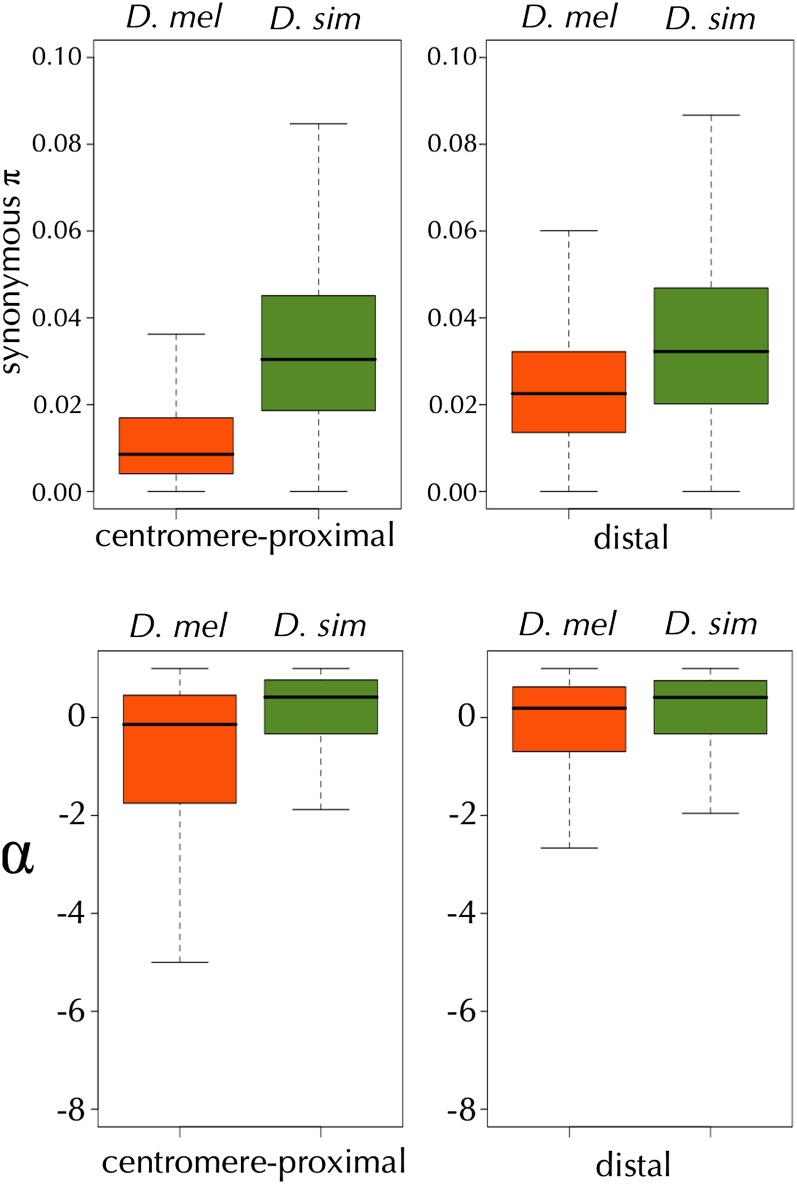
Figure 15 .
Comparisons of the levels of synonymous polymorphism (πs) and the proportions of amino acid fixations driven by positive selection (α) in centromere-proximal and distal regions of the autosomes of D. melanogaster (shown in olive) and D. simulans (shown in orange). Using the -smoothed map of the recombination rate, the boundaries between the centromere-proximal and distal regions were chosen to be the first interval where > 1.8 × 10⁻⁸ M/bp, 4,714,046 for 2L, 9,716,832 for 2R, 2,350,586 for 3L, and 13,015,705 for 3R.

