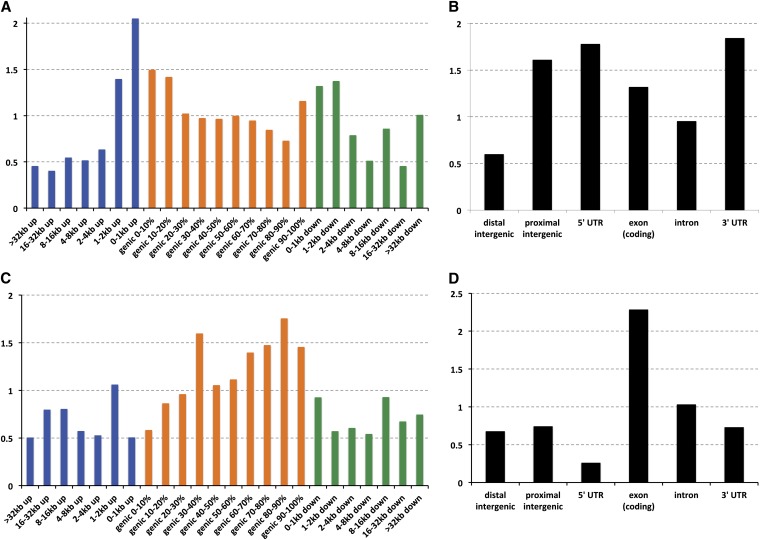
Figure 18 .
The distribution of HKAl outliers along gene regions and among functional classes of sites. The number of outlier windows centering on each gene position bin (A and C) or functional element (B and D) was compared against the total number of analyzed windows centering on each of these categories for MW HKAl, for low outliers (A and B) and high outliers (C and D). Over- and underrepresentation of each category was calculated such that a value of 1 matches the random genome-wide expectation, while a value of 2 indicates twice as many HKAl outliers in this category as expected randomly. Gene positions (A and C) were defined with regard to the beginning of the 5′-UTR and the end of the 3′-UTR. “kbp” bins indicate distance upstream or downstream of these limits, while genic bins indicate relative position between these limits and encompass 5′-UTR, coding exon, intron, and 3′-UTR sequences. These categories are depicted separately, along with proximal intergenic (within 2 kbp of a gene) and distal intergenic regions, in B and D.

