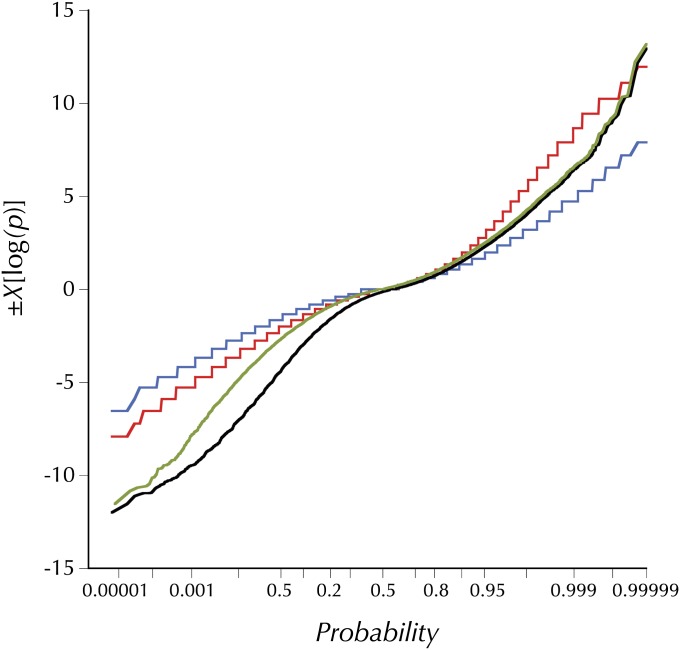
Figure 2 .
The distributions of observed and simulated HKAl (signed chi-square) values. The olive line is the distribution of observed HKAl values for all adjacent windows of 50 variant sites (segregating or fixations on the melanogaster lineage) for which the expected numbers derive from the observed averages in the large subset of these windows outside the designated (“trimmed”) centromere- and telomere-proximal regions with low crossing over. The black line shows the distribution of HKAl for the same windows, using the observed averages for all windows to derive the expected numbers. The blue and red lines are the theoretical distributions for high and no recombination derived from simulations using Hudson’s ms program with the commands ms 35 1000000 -s 50 -r 8 500 -I 2 1 34 -ej 2.5 1 2 or -r 0, respectively. The parameter -ej 2.5 relates the outgroup divergence time to 4N0 and yields the observed proportion of segregating sites (0.44), both averaged over all sample sizes and only at sites with 34 observed alleles, the simulated number.

