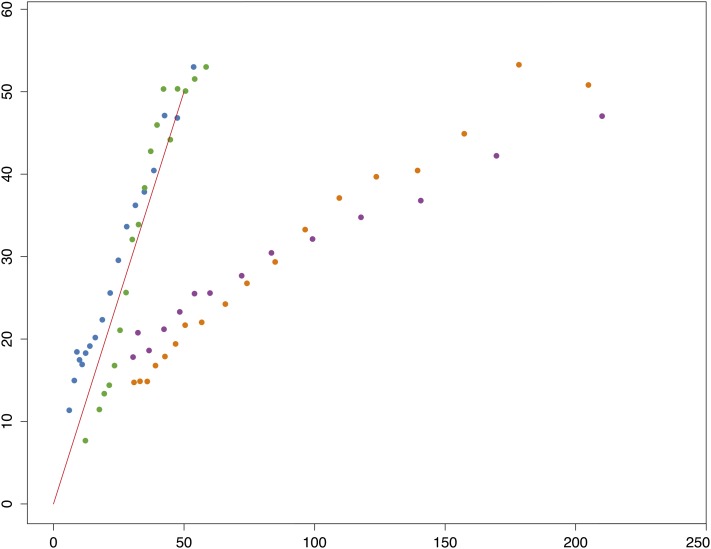
Figure A5 .
Empirical quality (y-axis) vs. the consensus quality score Q (x-axis) from the MAQ assemblies of both ycnbwsp assemblies (one purple and one orange). The ideal relationship between the idealized quality score and the empirical quality is shown with the red line. The final recalibrated consensus quality scores for both ycnbwsp assemblies are plotted in green and blue. The recalibrated consensus quality scores show improved accuracy as they are much closer to the ideal relationship. See text.

