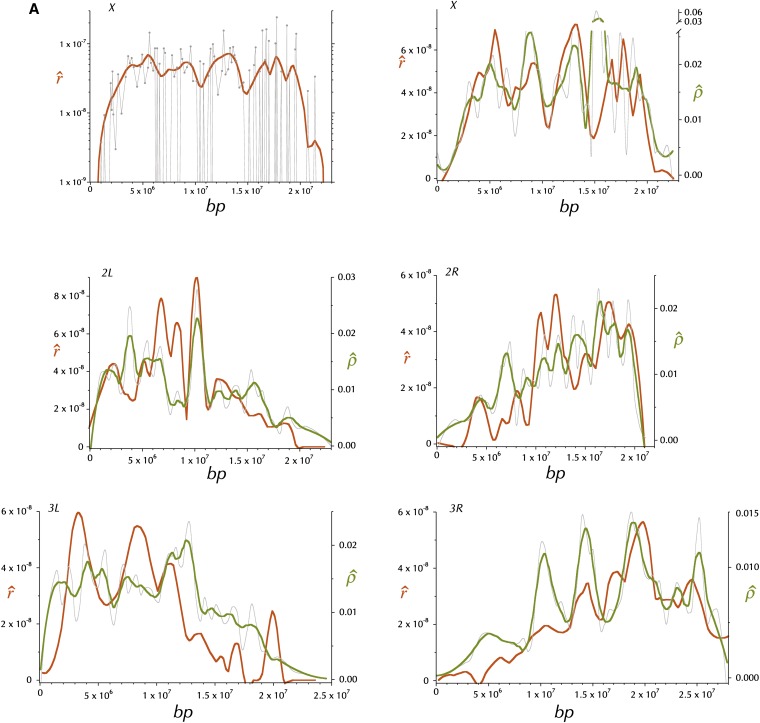
Figure 3 .
Distributions of estimates of the rates of recombination per base pair, r (M/bp) and ρ = 2Nr, where N is the populations size (see text). is the (orange) loess-smoothed (span = 15%) per genome per generation estimate of the rate of recombination between adjacent base pairs, derived from curated FlyBase genetic map positions. (A) and the estimated r for each subdivision on the X, plotted on a logarithmic scale. is the (olive) comparably (span = 15%) loess-smoothed per population per generation estimate of the rate of recombination (2Nr) between adjacent base pairs (see text). The gray line is the higher-resolution (span = 8%) smoothed estimate of 2Nr, .

