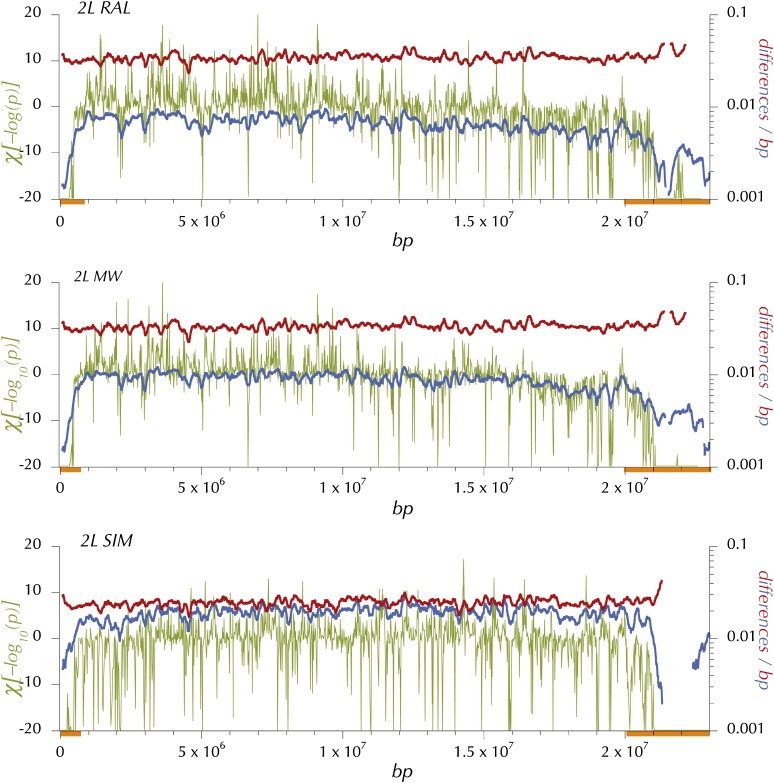
Figure 6 .
Expected heterozygosity, πw, divergence, δw, and HKAl on 2L for the North American (RAL), African (MW), and simulans (SIM) samples. Blue shows expected heterozygosity, πw at the midpoint of 150-kbp windows (incremented every 10 kbp, minimum coverage = 0.25 and Q30 sequence). Red shows lineage-specific, Q30 divergence, δw in 150-kbp windows (incremented every 10 kbp and minimum coverage of 0.25). A preliminary application of HKAl on the Q30 data in windows of 4096 contiguous polymorphic or divergent sites identified centromere- and telomere-proximal regions (orange bars) in which the each window exhibited a deficiency of polymorphic sites relative to the chromosome-arm average. Then HKAl was applied to the Q30 data in windows of 512 contiguous polymorphic or divergent sites (excluding these centromere-and telomere-proximal regions from calculation of the chromosome-arm–wide expected proportions, pc and dc). χ[log(pHKAl)] (olive) is the logarythim of the P-value associated with the HKAl plotted with the sign of the difference between the observed number and the expected number of polymorphic sited in nonoverlapping windows of 512 variable sites.

