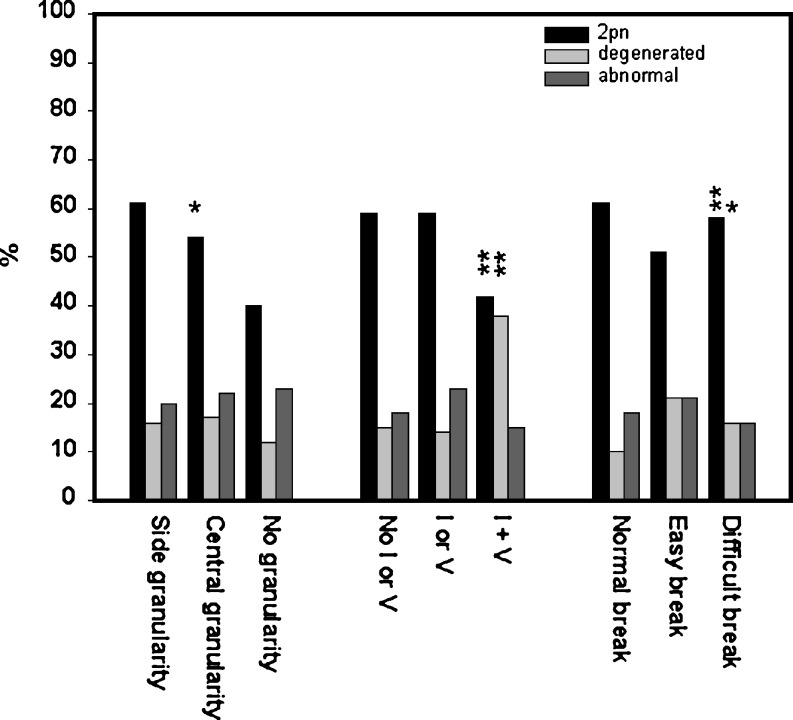
Fig. 2.
Biological results after morphological analysis of human oocytes during ICSI cycles. Results show percentages of normal and abnormal fertilisation rates and percentage of oocyte lysis after intracytoplasmic sperm injection in oocytes in which morphological analysis preceded the ICSI procedure. Black bars are percentages of normal fertilisation, light grey bars percentages of oocyte degeneration and dark grey bars percentages of abnormal fertilisation (i.e. one pronucleus). The subtitles are the single morphological parameters observed. I Inclusions, V vacuoles. Asterisk denotes data significantly different from first parameter (p < 0.05, two-tailed t test). Two asterisks represent data highly significantly different from first parameter (p < 0.001, two-tailed t test). The data is derived from a total of 2,017 oocytes in which fertilisation was verified after the analysis of morphology

