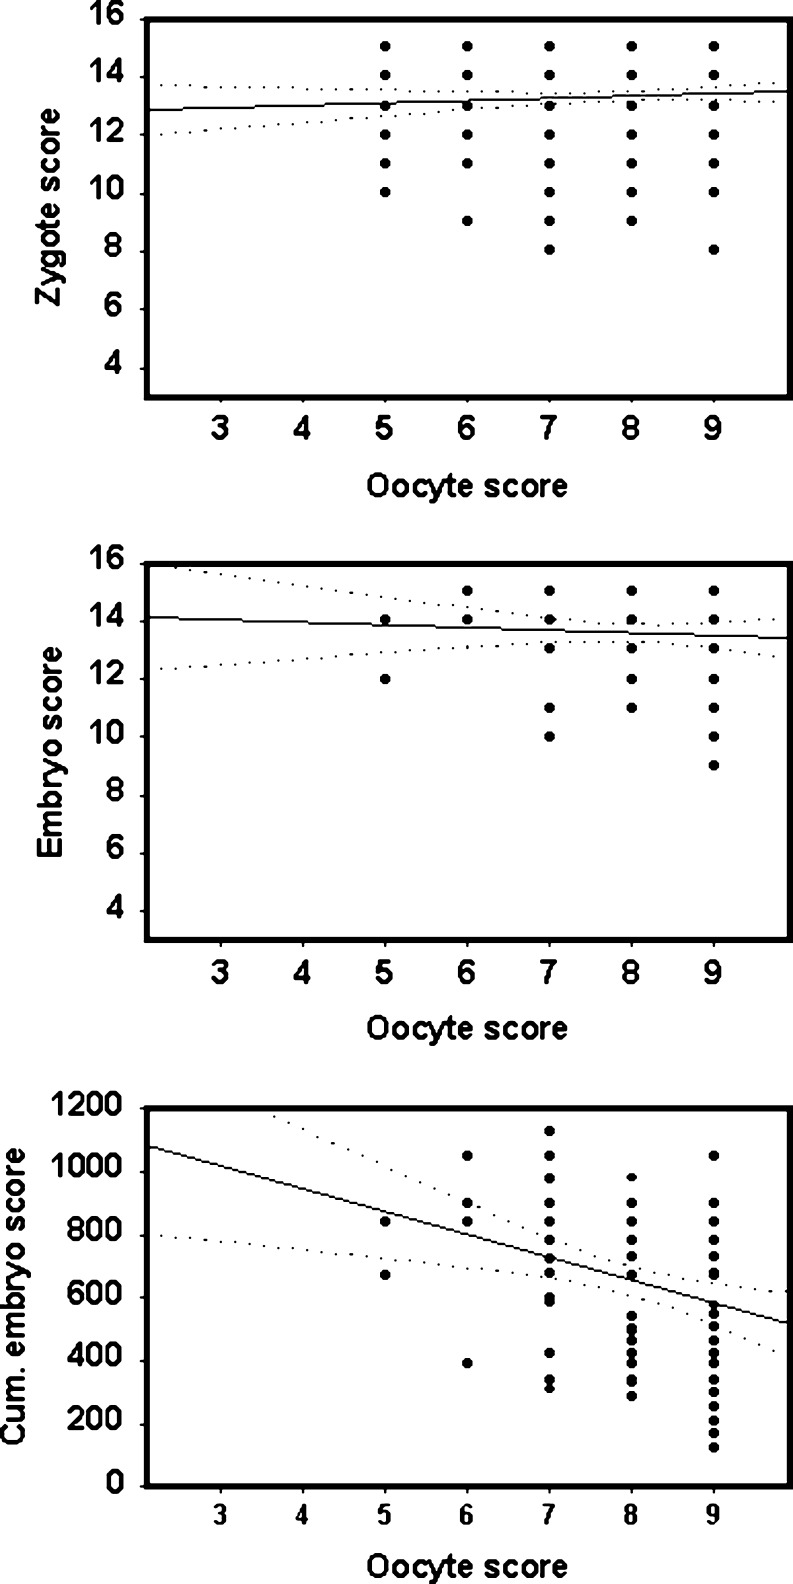
Fig. 4.
Correlations between oocyte morphological scores and morphological scores applied during the first two days of development. Top Correlation between oocyte and zygote morphology. Centre Correlation between oocyte morphology and embryo morphology. Embryo morphology was assessed on day 2 (40–41 h after fertilisation). Bottom Correlation between oocyte morphology and cumulative embryo score. Zygote, embryo and cumulative scores were assessed according to previous work [51]. Continuous line shows correlation coefficient and dotted lines are the 95% confidence intervals. The data is derived from a total of 2,017 oocytes in which fertilisation was verified after the analysis of morphology

