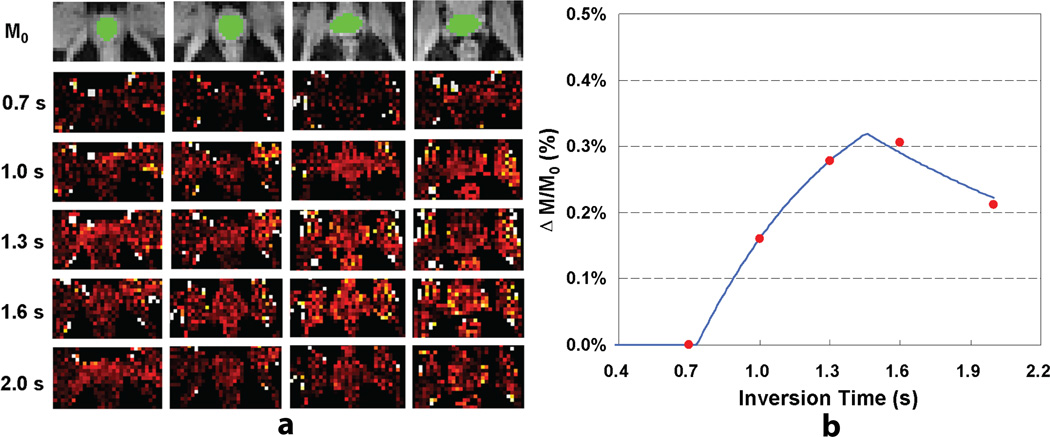
Figure 2.
Prostate perfusion imaging results from one subject: (a) proton density images with overlaid ROIs (top row) and perfusion-weighted imaging maps acquired at different delay times from one subject; (b) a plot of ASL signal changes as a function of delay time and the corresponding model fitting curve.

