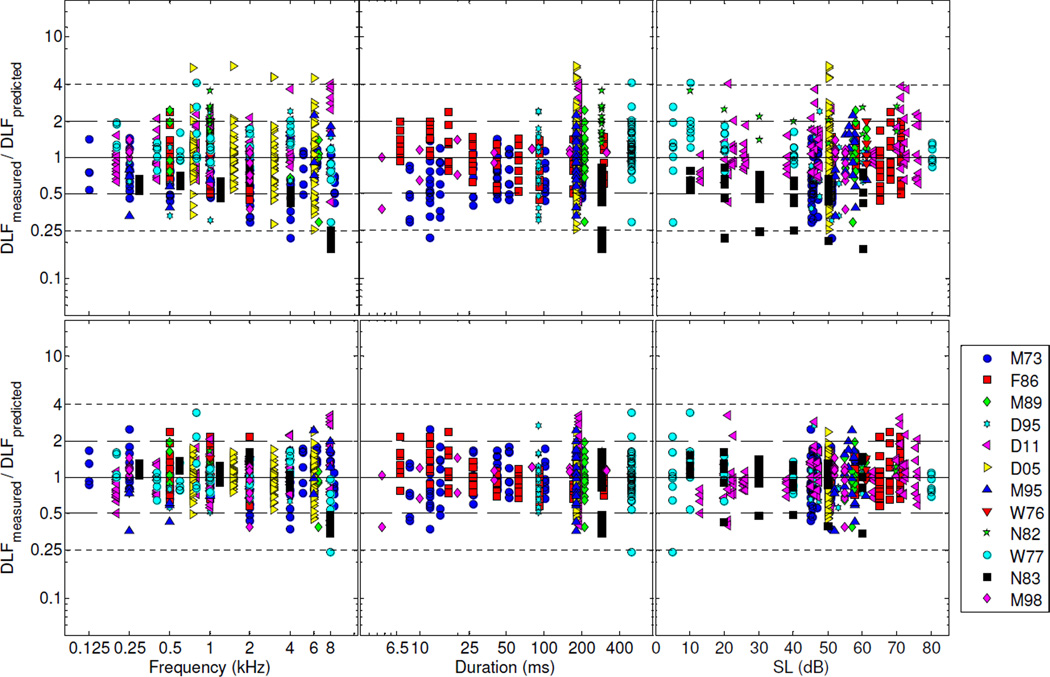
Figure 3.
Fit residuals for the full model (Model A). Upper row: residuals for predictions obtained using equation 2 with the random effects set to zero. Bottom row: residuals for predictions obtained using equation 2 with the random effects replaced by their ML estimates. The solid line indicates a measured-to-predicted DLF ratio of 1, which corresponds to the situation in which the predicted DLF is exactly equal to the measured DLF. The long- and short-dash lines indicate measured-to-predicted DLF ratios of 2 and 0.5, and 4 and 0.25, respectively.

