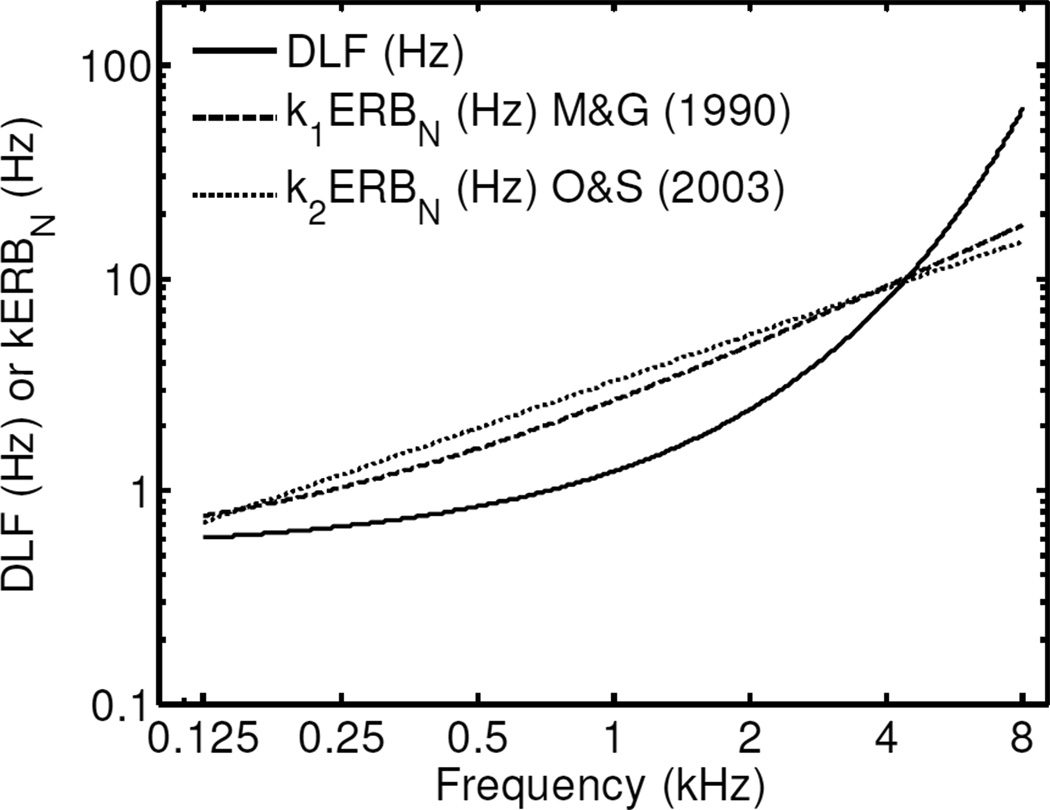
Figure 7.
DLF predictions as a function of frequency for Model A versus a constant proportion of the ERBN. The ERBN was computed using the equations provided by Glasberg and Moore (1990) and Oxenham and Shera (2003). The proportionality constants, k1 and k2, were adjusted to minimize the RMSE between the ERBN predictions and the predictions of Model A.

