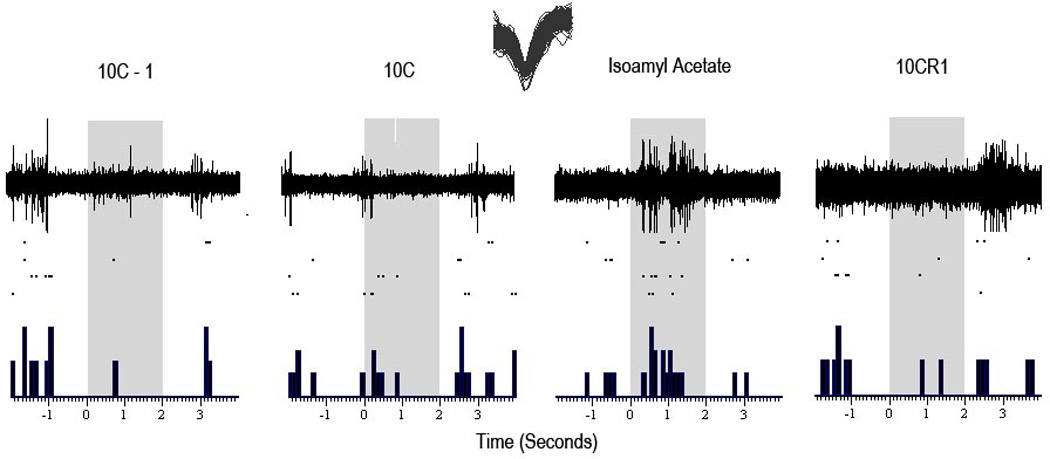
Figure 2.

Representative odorant responsivity to 4 sample odors in a single unit in the LEC from a single mouse. The top half shows waveform activity in response to a single presentation of the named odorant. The bottom half shows raster plots (dots) of responsivity to each presentation of an odor. Rasterplots and peristimulus time histograms (PSTH) show reliability of responses. Data for rasters and PSTHs obtained by extraction of single-unit activity from the raw recordings (see Methods). Overlapping single-unit waveforms shown on top. Odorant presentation time is enclosed in the shaded area starting from 0 seconds to 2 seconds.
