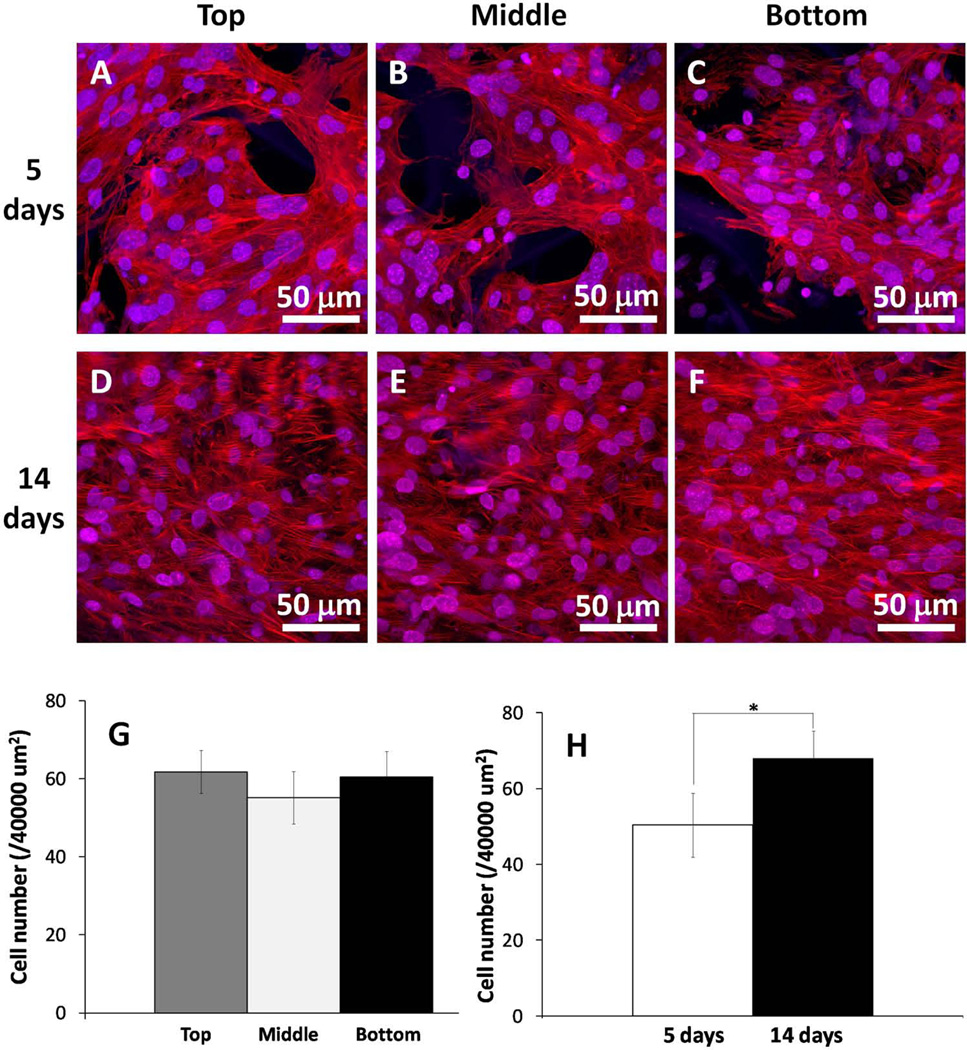
Figure 3.
Osteoblast migration and proliferation on 3D-NF-GS. (A–C) Projected z stack CLSM images of osteoblasts cultured on 3D-NF-GS for 5 days. (D–F) Projected z stack CLSM images of osteoblasts cultured on 3D-NF-GS for 14 days. (G) Quantification of cell numbers in different areas (top, middle, and bottom) of the scaffold at day 5. (H) Quantification of average cell numbers in the samples at 5 and 14 days.

