Figure 5.
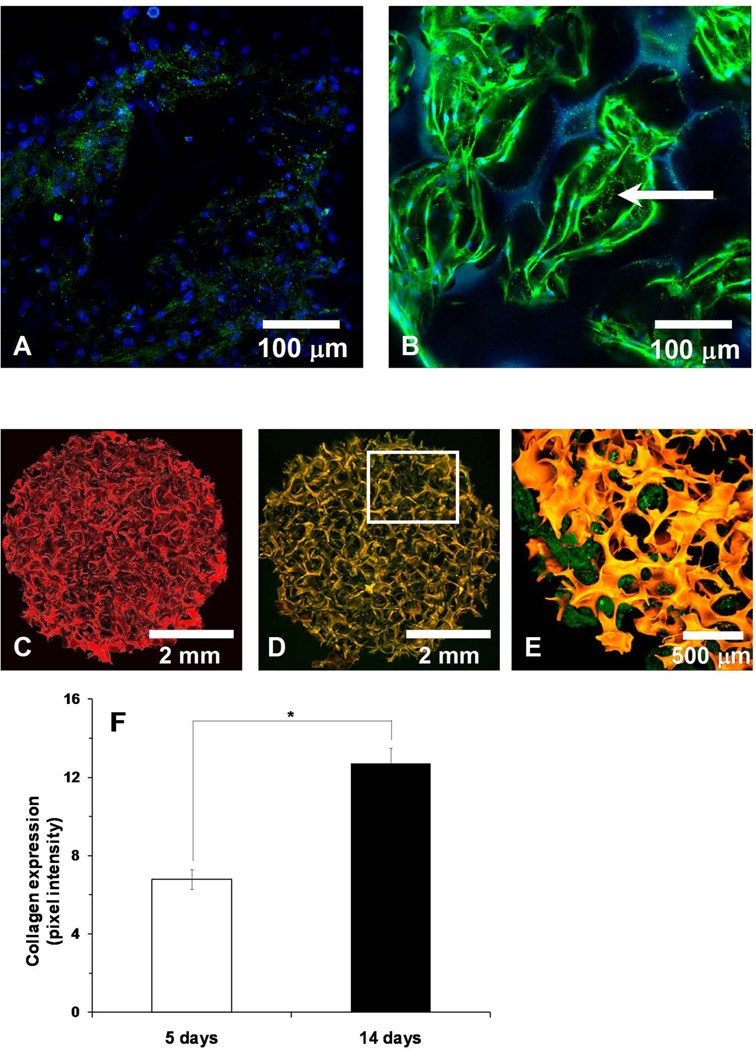
Collagen type I (Col I) production by the osteoblasts on 3D-NF-GS. (A) Projected z stack CLSM image of osteoblasts cultured on 3D-NF-GS for 5 days, showing scattered collagen deposition. (B) Projected z stack CLSM image of osteoblasts cultured on 3D-NF-GS for 14 days, showing nodule aggregation and greater collagen deposition (blue-nuclues, green-Col I, dotted line-pore of scaffold). (C) Projected z stack CLSM image of an unseeded TRITC labeled 3D-NF-GS. (D) Osteoblasts seeded on TRITC labeled 3D-NF-GS and cultured for 14 days (red-scaffold, green-Col I). (E) Higher magnification picture of area highlighted in (D). (F) Quantification of Col I expression on the 3D-NF-GS.

