Figure 4.
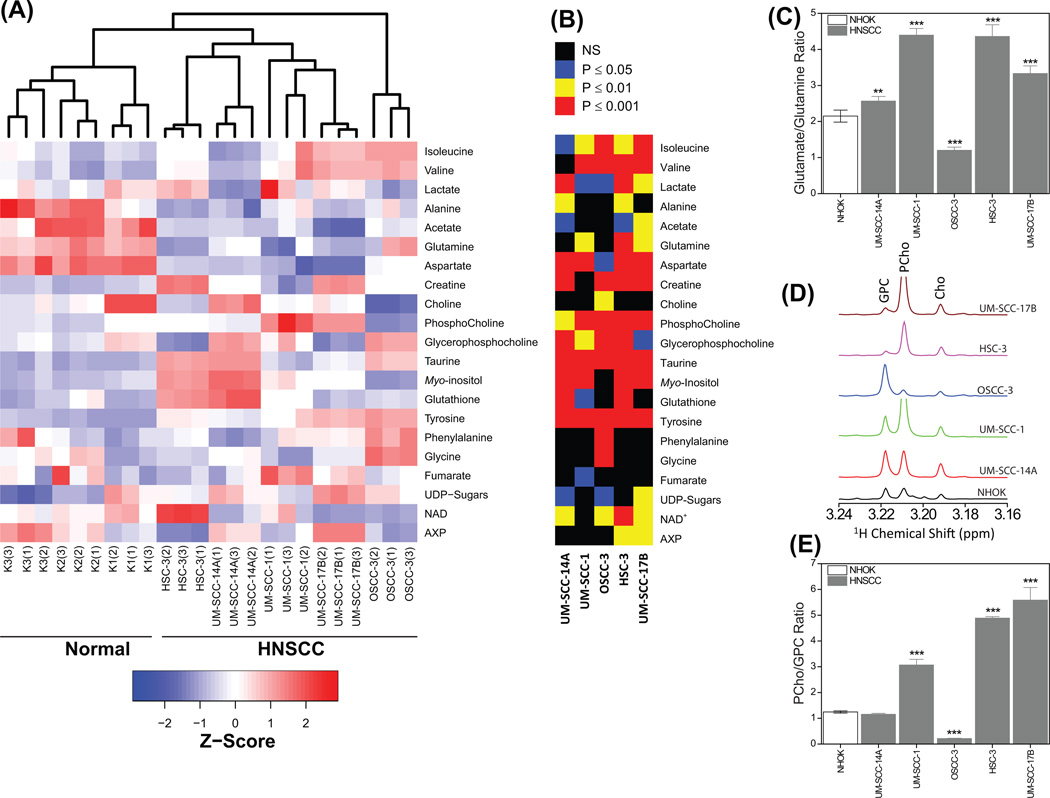
(A) Heat map showing the z-score of twenty-one quantified metabolites in three NHOK and five HNSCC cells grown independently in triplicates. An unsupervised hierarchical classification showing separate cluster for normal and HNSCC is also included in the heat map. (B) P values obtained by comparing metabolite levels of normal and HNSCC cells using two-tailed Student’s t-test followed by a correction for multiple hypothesis testing (Benjamini-Hochberg correction). (C) Bar plots (mean ± SD) showing altered glutamate:glutamine ratio in HNSCC cells compared to NHOK. **P < 0.01; ***P < 0.001. (D) Expanded chemical region of −N(CH3)3+ signals of choline containing metabolites showing the altered levels of PCho and GPC in HNSCC cells. (E) Bar plots (mean ± SD) showing altered PCho:GPC ratio in HNSCC cells compared to NHOK. ***P < 0.001.

