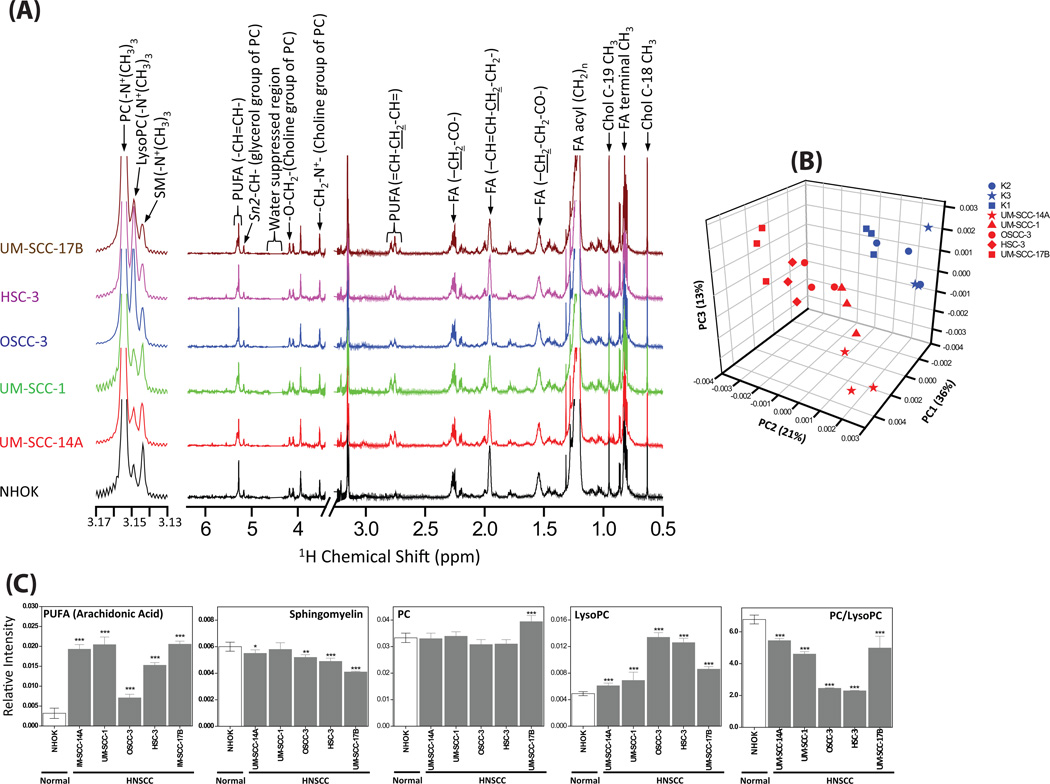
Figure 5.
(A) Average 1H NMR spectra obtained from the area normalized 1H NMR spectrum of lipid extract of each independently grown (triplicates) cells of NHOK and various HNSCC cells. (B) 3D PCA score plot generated from the unsupervised PCA of NMR spectra of lipid extracts showing separate grouping for NHOK and HNSCC cells. (C) Bar plots showing the comparison (Student’s t-test) of relative intensities of cholesterol, poly unsaturated fatty acids (PUFA), sphingomyelin and PC/LysoPC ratio. ***P < 0.001; **P < 0.01; *P < 0.05.

