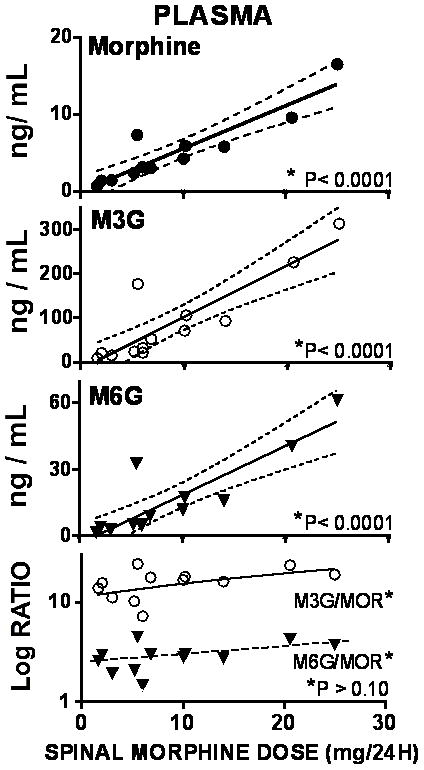
Figure 2.

Graphs plot the best fit regression line for the plasma concentrations of morphine, morphine 3 glucuronide (M3G) and morphine 6 glucuronide (M6G) plotted as a function of the daily intrathecal dose of morphine. Bottom graph plots the ratio of M3G to morphine (MS) and M6G to morphine in cerebrospinal fluid (CSF) as a function of daily dose. The ratio of M6G to M3G was calculated (not shown) * in each graph indicates the statistical significance of the slope of the regression lines of the respective plot. As shown, the slopes of the regression lines for morphine, M3G and M6G were statistically significant, while the slope of the regression lines for the ratio versus dose was not. Where a statistically significant slope was found, the 95% CI is plotted (dashed lines)
