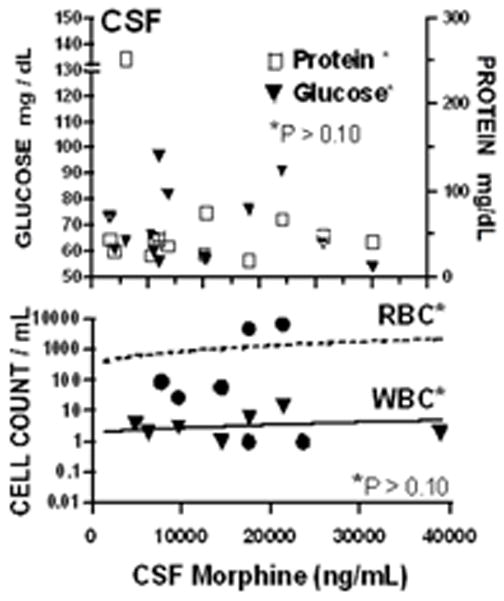
Figure 5.

Concentrations of protein and glucose (top) or red and white blood cell counts (bottom) in cerebrospinal fluid (CSF) are plotted as a function of daily intrathecal dose of morphine. No regression slope was statistically significant over dose (p > 0.10).
