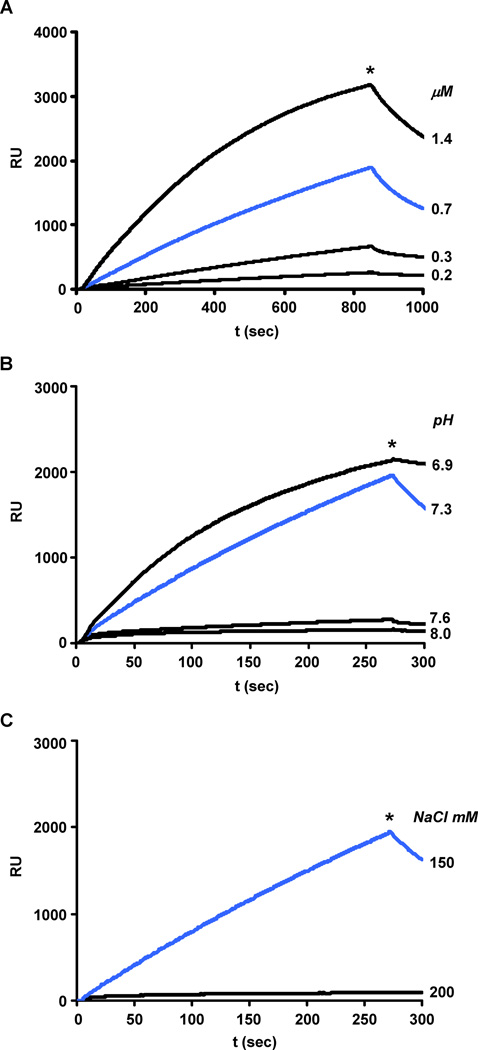
Fig. 1.
Binding of WT-LMM analyte to WT-LMM ligand depends on protein concentration, pH and salt concentration. The ligand was equilibrated in 10 mM TES at the pH and NaCl concentrations indicated below. Binding was initiated by flowing a solution of analyte over the ligand at protein concentration, pH, and NaCl molarity shown on the right side of each sensorgram in Panel A, B and C respectively. At the time indicated by the asterisk, the analyte solution was replaced by 10 mM TES/300 mM NaCl. The SPR sensorgram shown in Panel A was obtained at pH 7.3, NaCl 150 mM and analyte concentrations as indicated. The analyte concentration in the sensorgrams shown in Panels B and C was 0.45 µM: the reactions were carried out in NaCl 150 mM at the pH values indicated (panel B) and at pH 7.3 at the NaCl concentration indicated (panel C).

